Dashboards
The Office of Institutional Research is in the process of redesigning dashboards.
Please submit a Research Request for data needed meanwhile. The below list of dashboards are being reviewed for updates.
Accessing Dashboards: New dashboards are being built via the Tableau platform. If Tableau access is required,
please enter your email and you will be directed to sign in via the COD single sign
on process. Request access if not immediately available by reaching out to the Director
of Institutional Research.
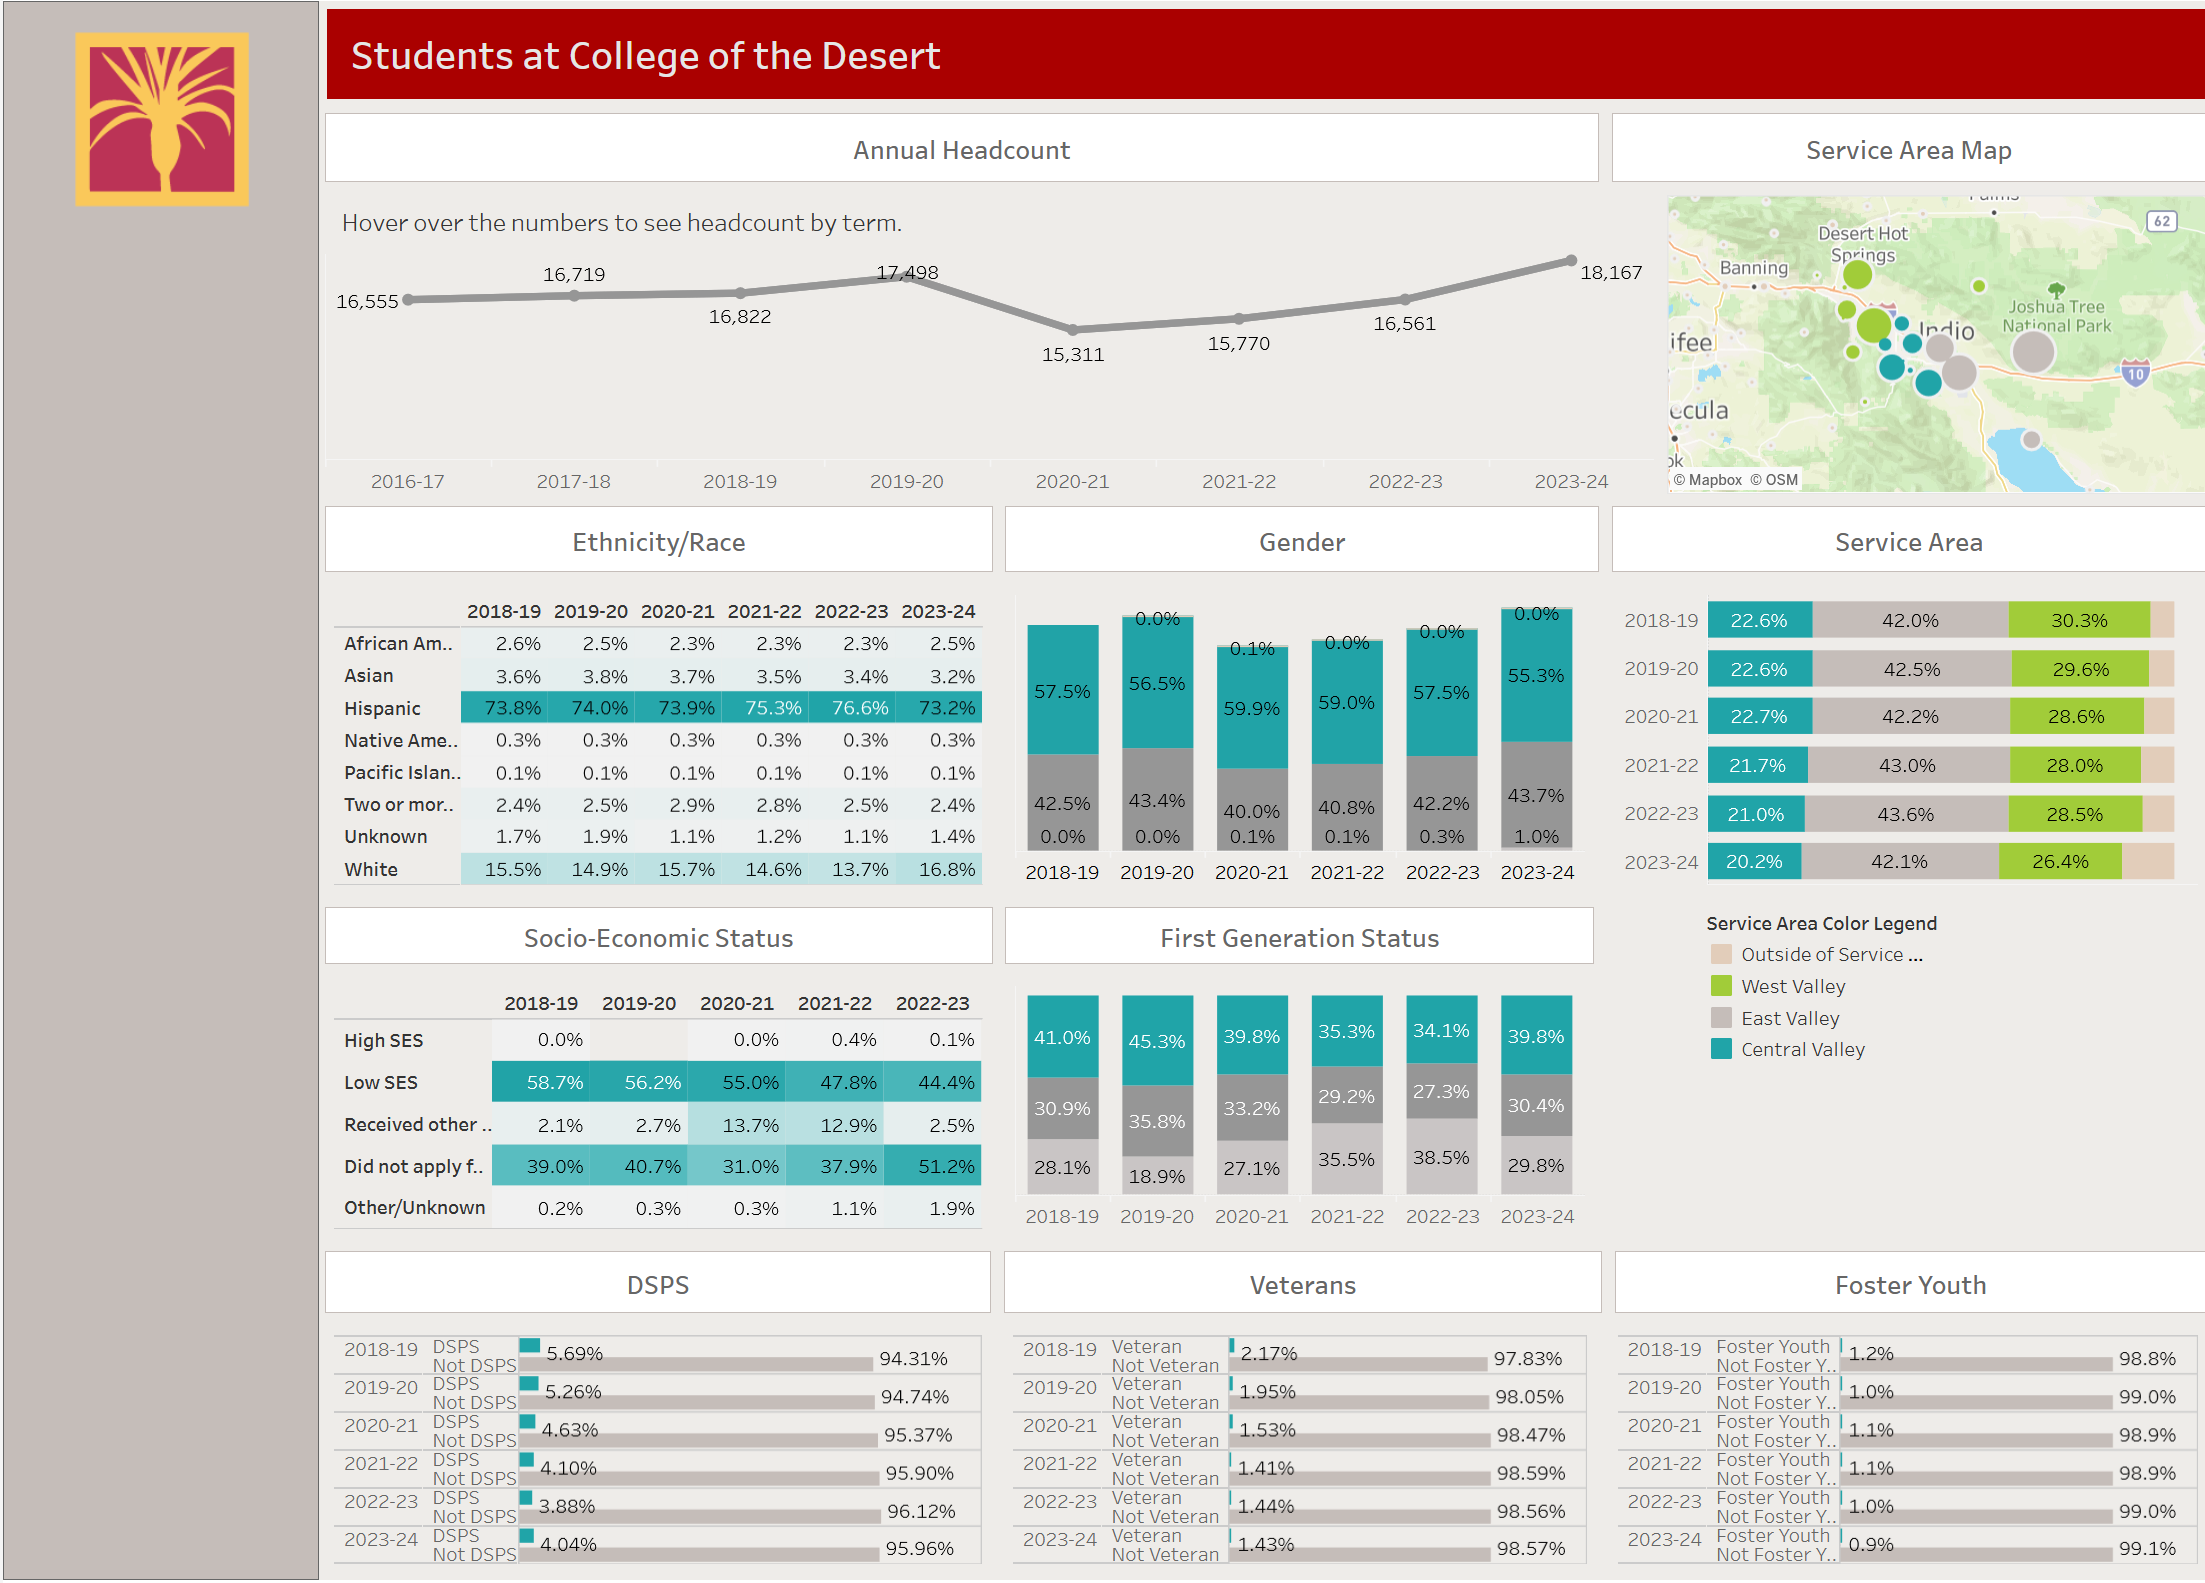
Students at College of the Desert
Student Information dashboard view includes student headcount disaggregated by student demographics and characteristics.
Annual headcount is visualized and the term headcount can be viewed via the tool tip.
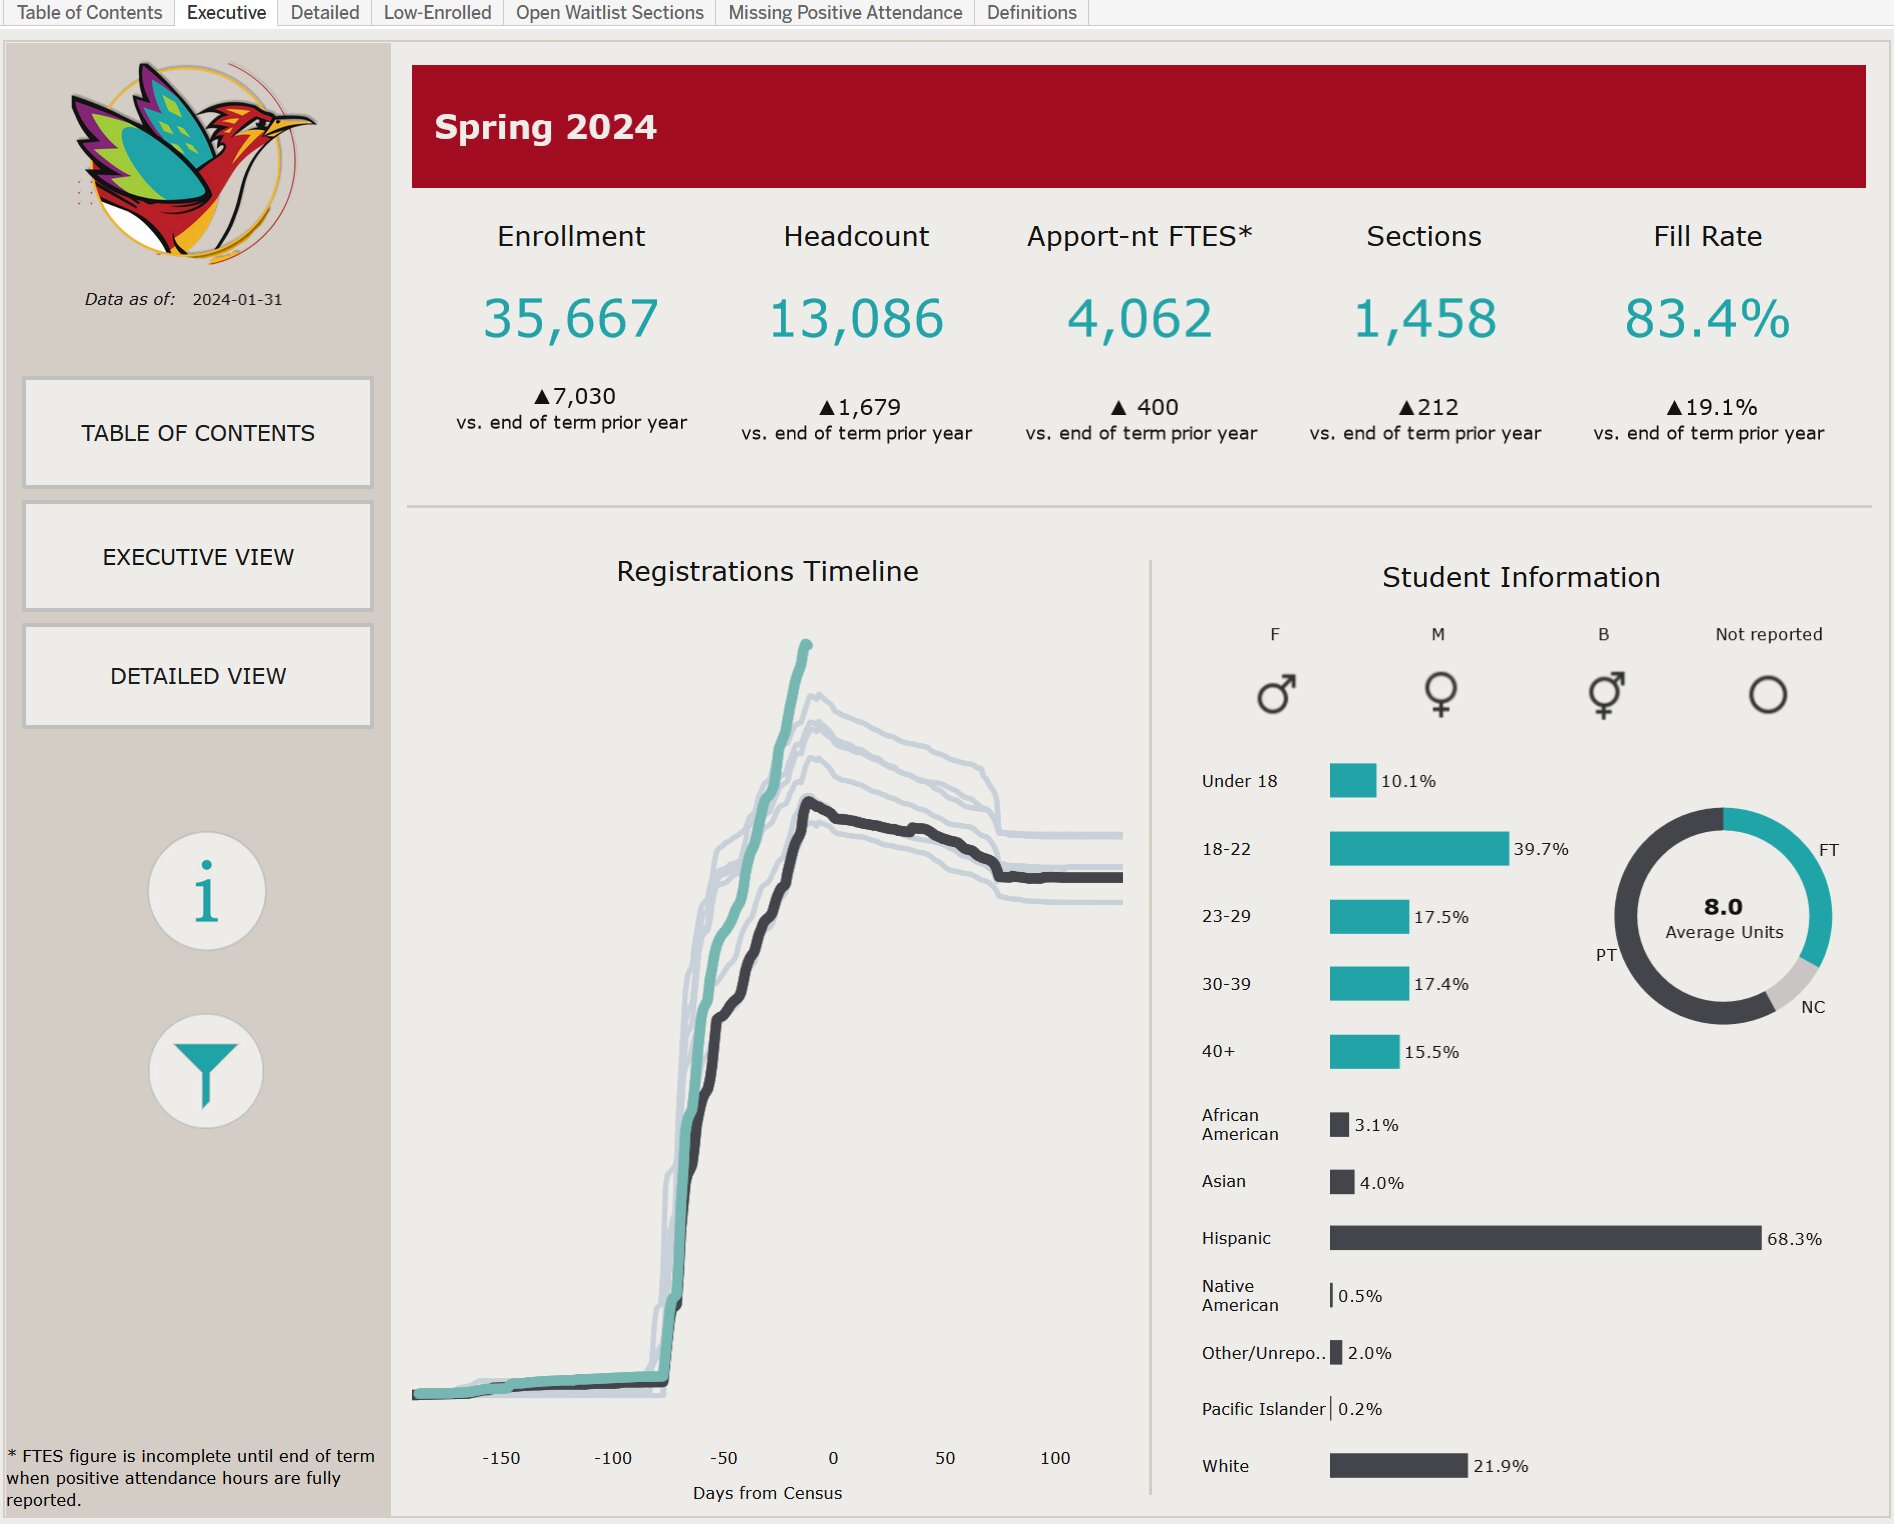
Enrollment Management
Enrollment Management Dashboard includes current and historical enrollment data. Its primary goal is to provide live
data disaggregated by student and class information to support decision making as
related to enrollment management. This dashboard is updated frequently and the latest
update date is indicated under the dashboard logo.
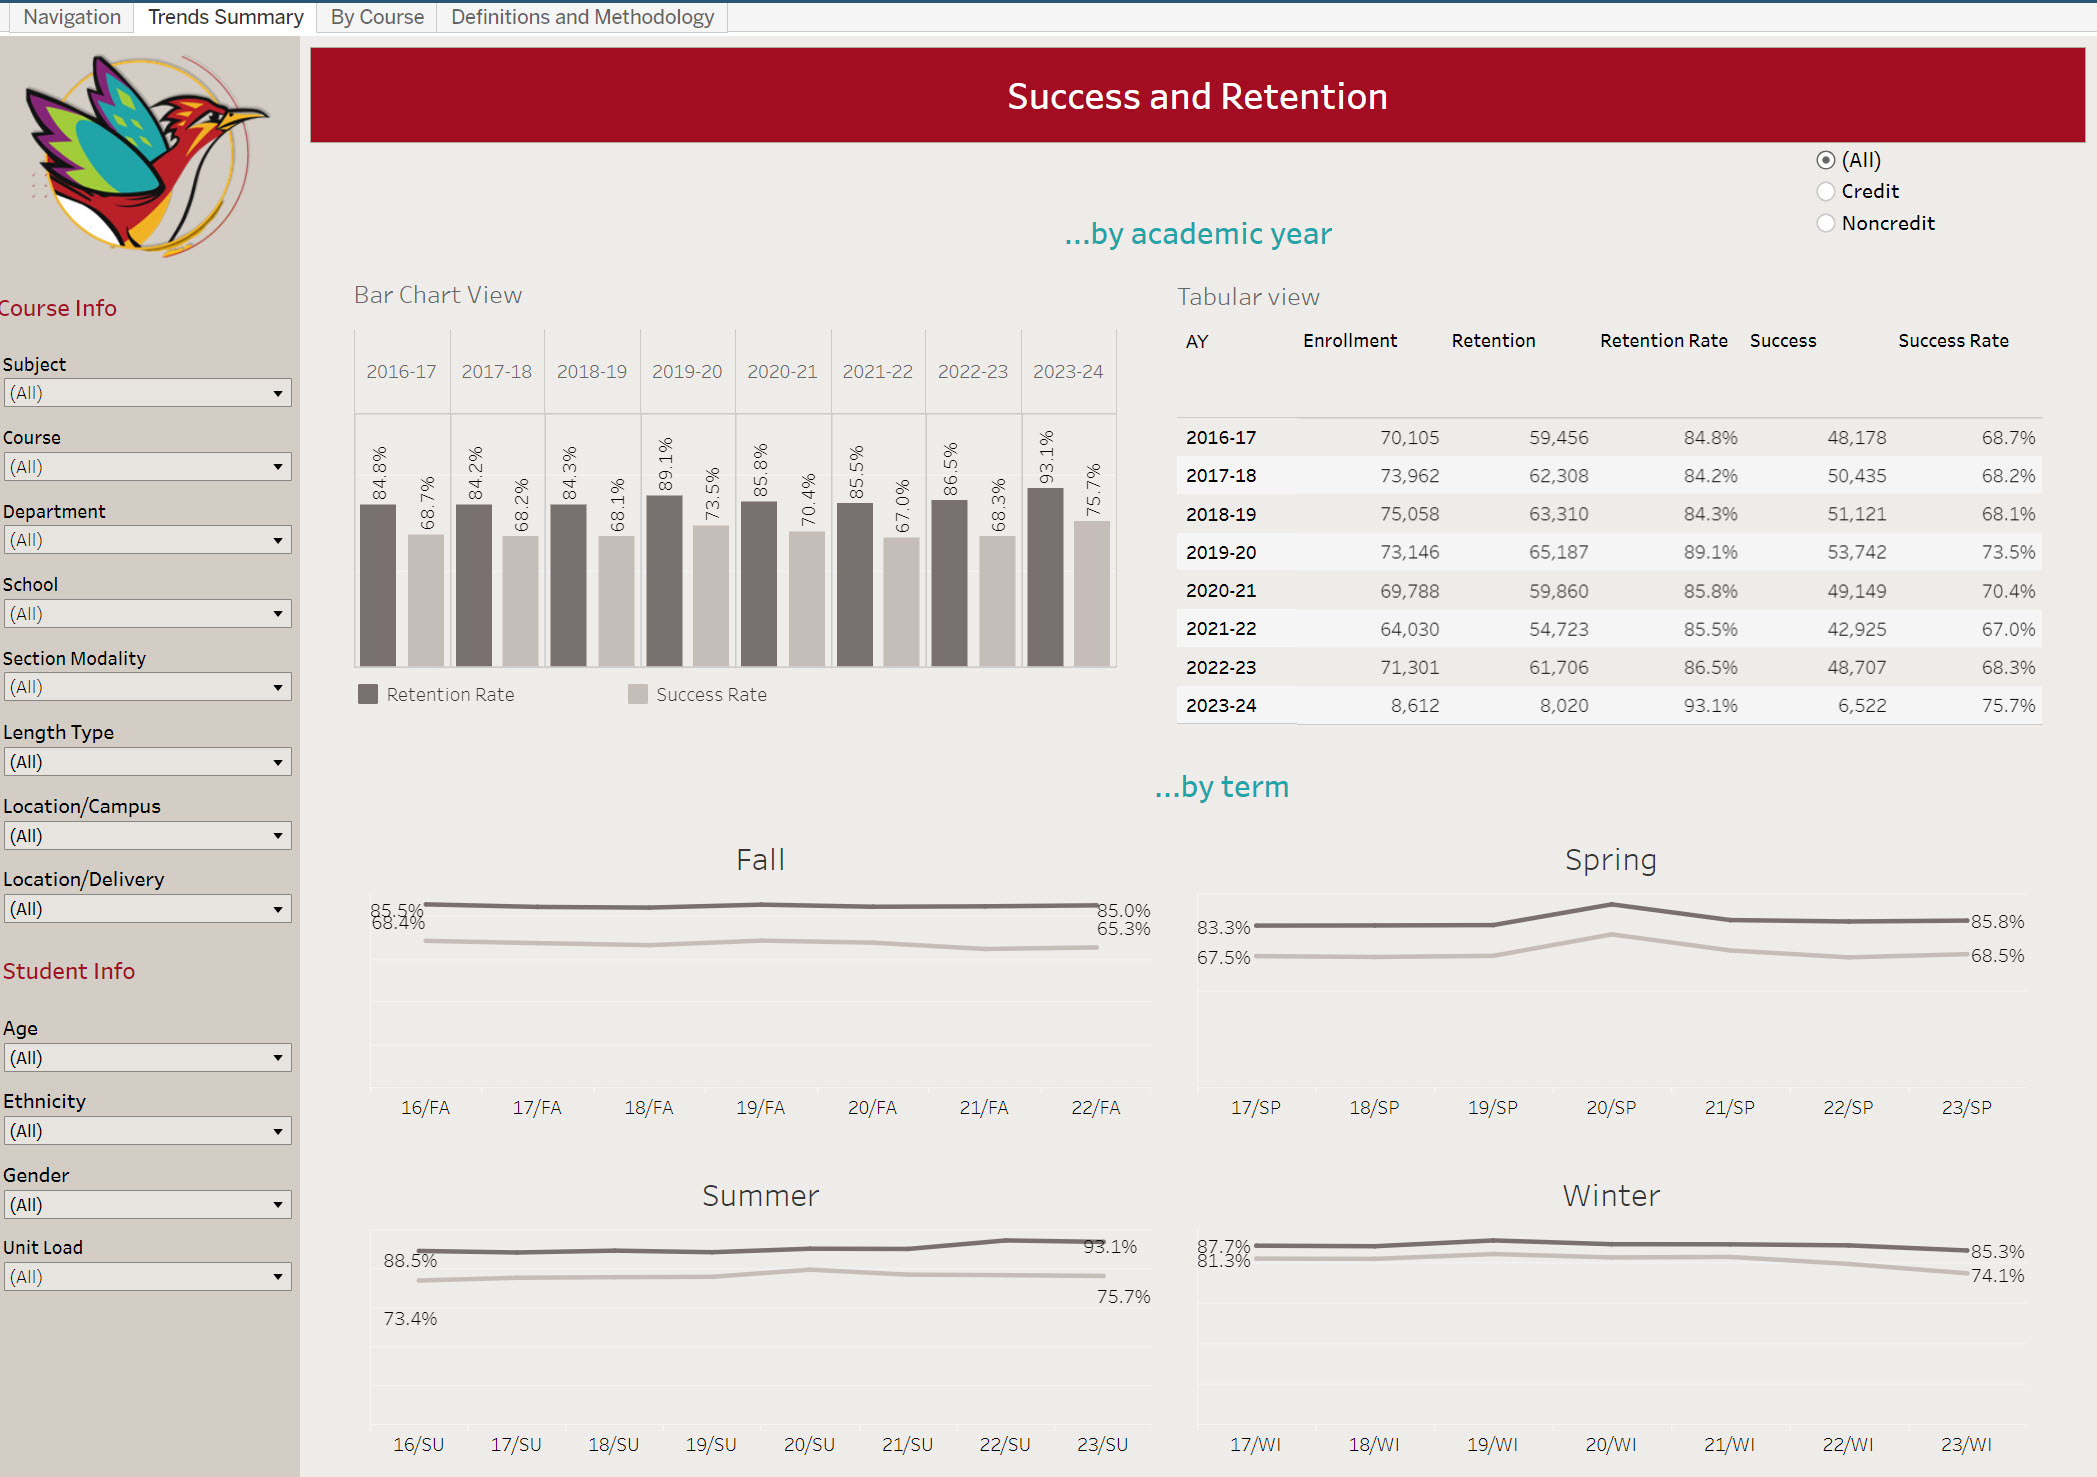
Course Outcomes: Retention, Success, Completion
Course Outcomes Dashboard includes historical trends and data disaggregated by student demographics. Tableau
access required.
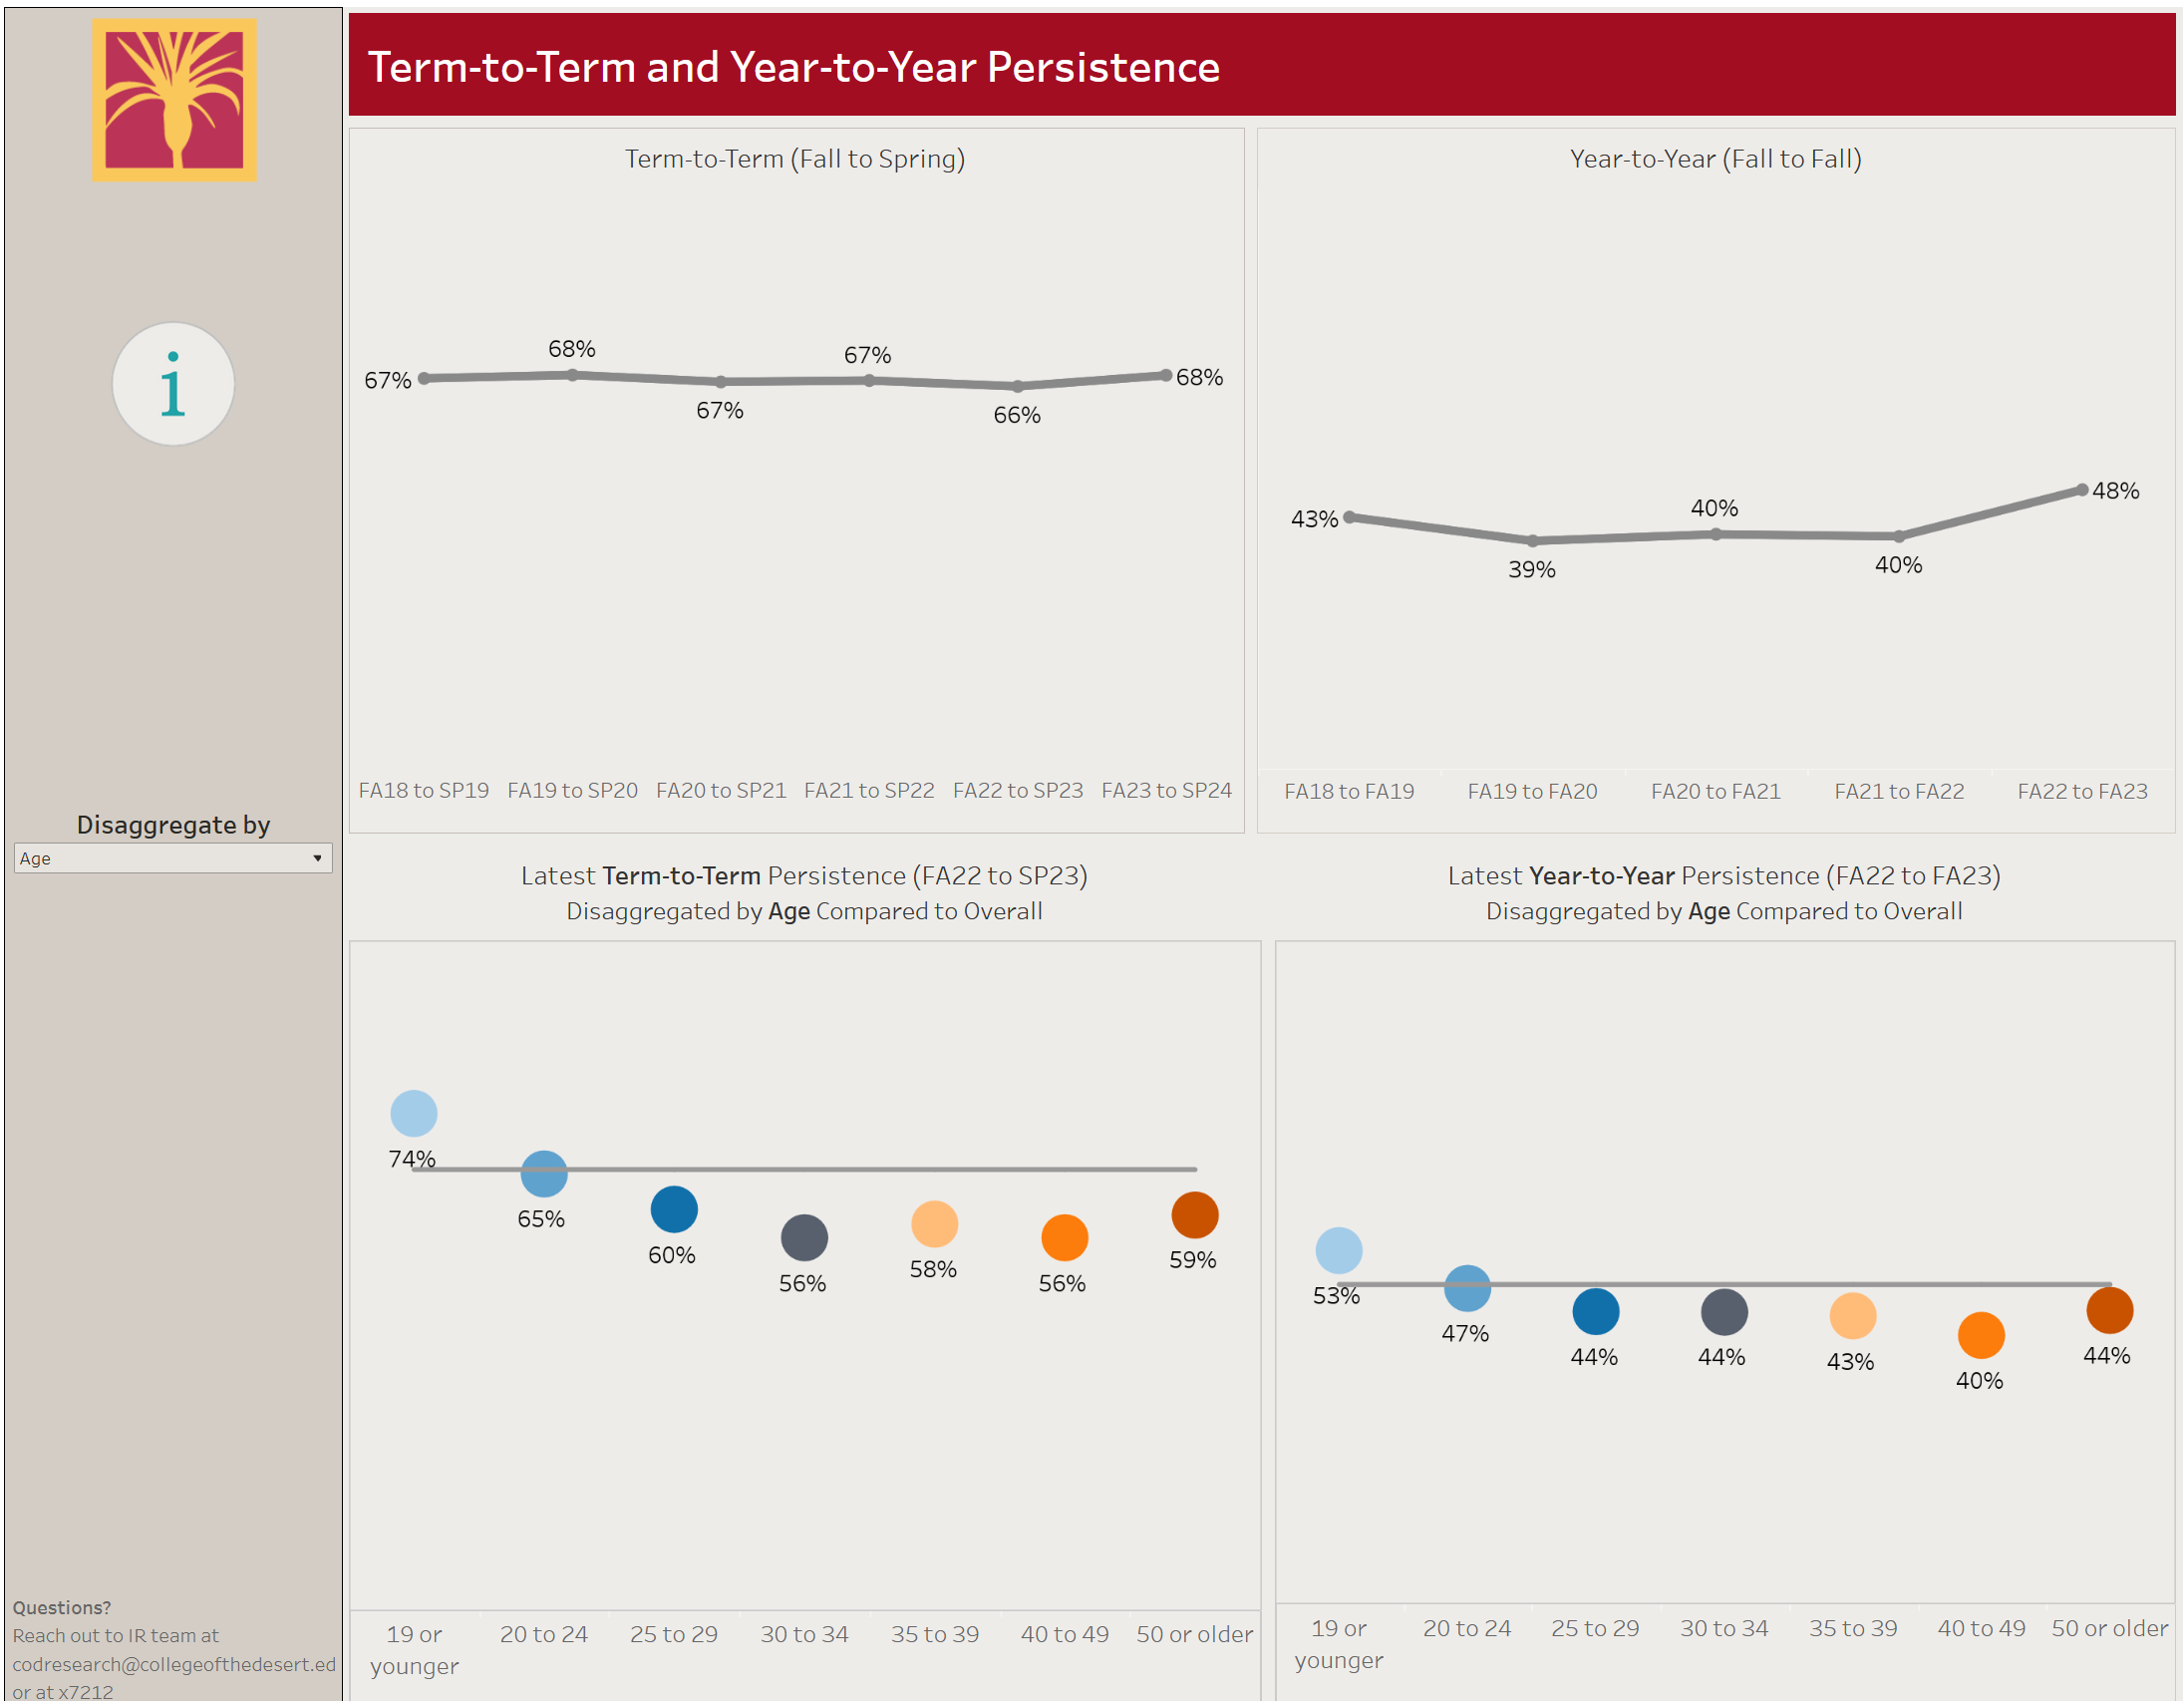
Persistence from Term-to-Term and Year-to-Year
Persistence from Term-to-Term and Year-to-Year Dashboard includes a historical trend and data disaggregated by student demographics compared
to overall persistence. Tableau access required.
Student Educational Plans (SEPs)
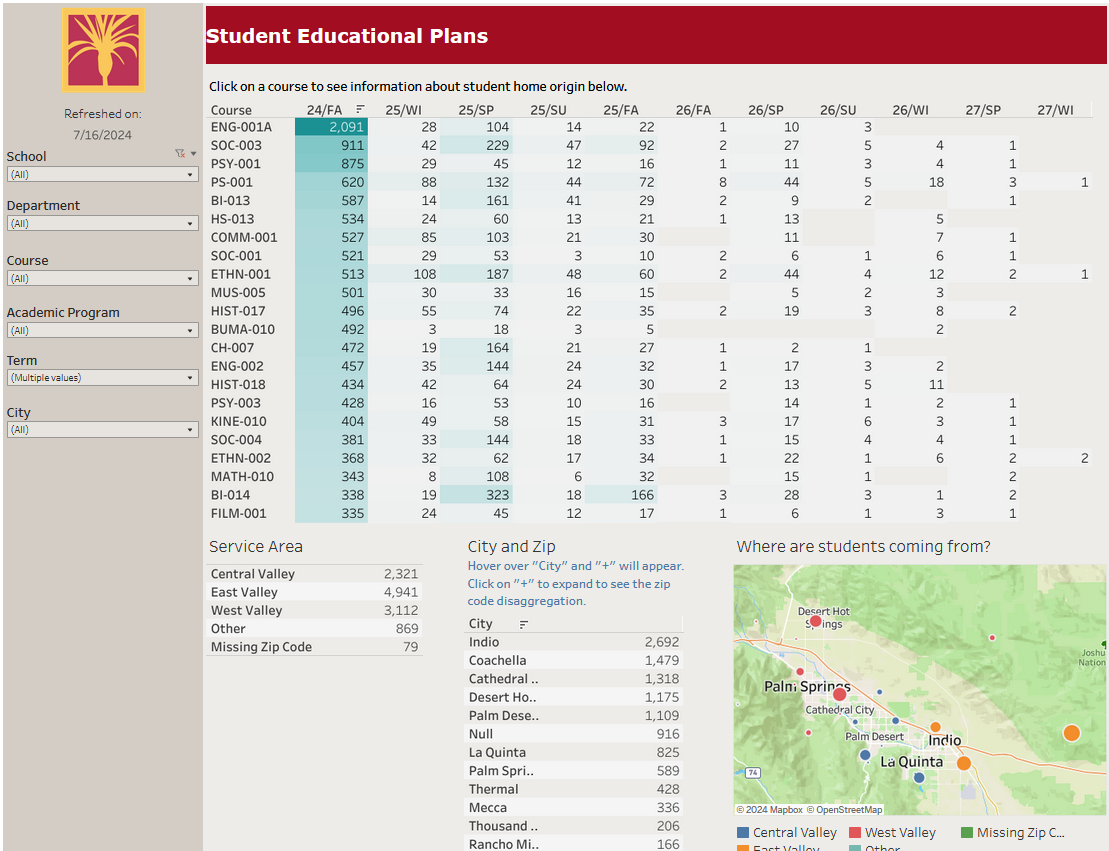
Student Educational Plans Dashboard includes courses students indicated planning to take in each future term. Tableau
access required.
Drop Reasons and Timeline
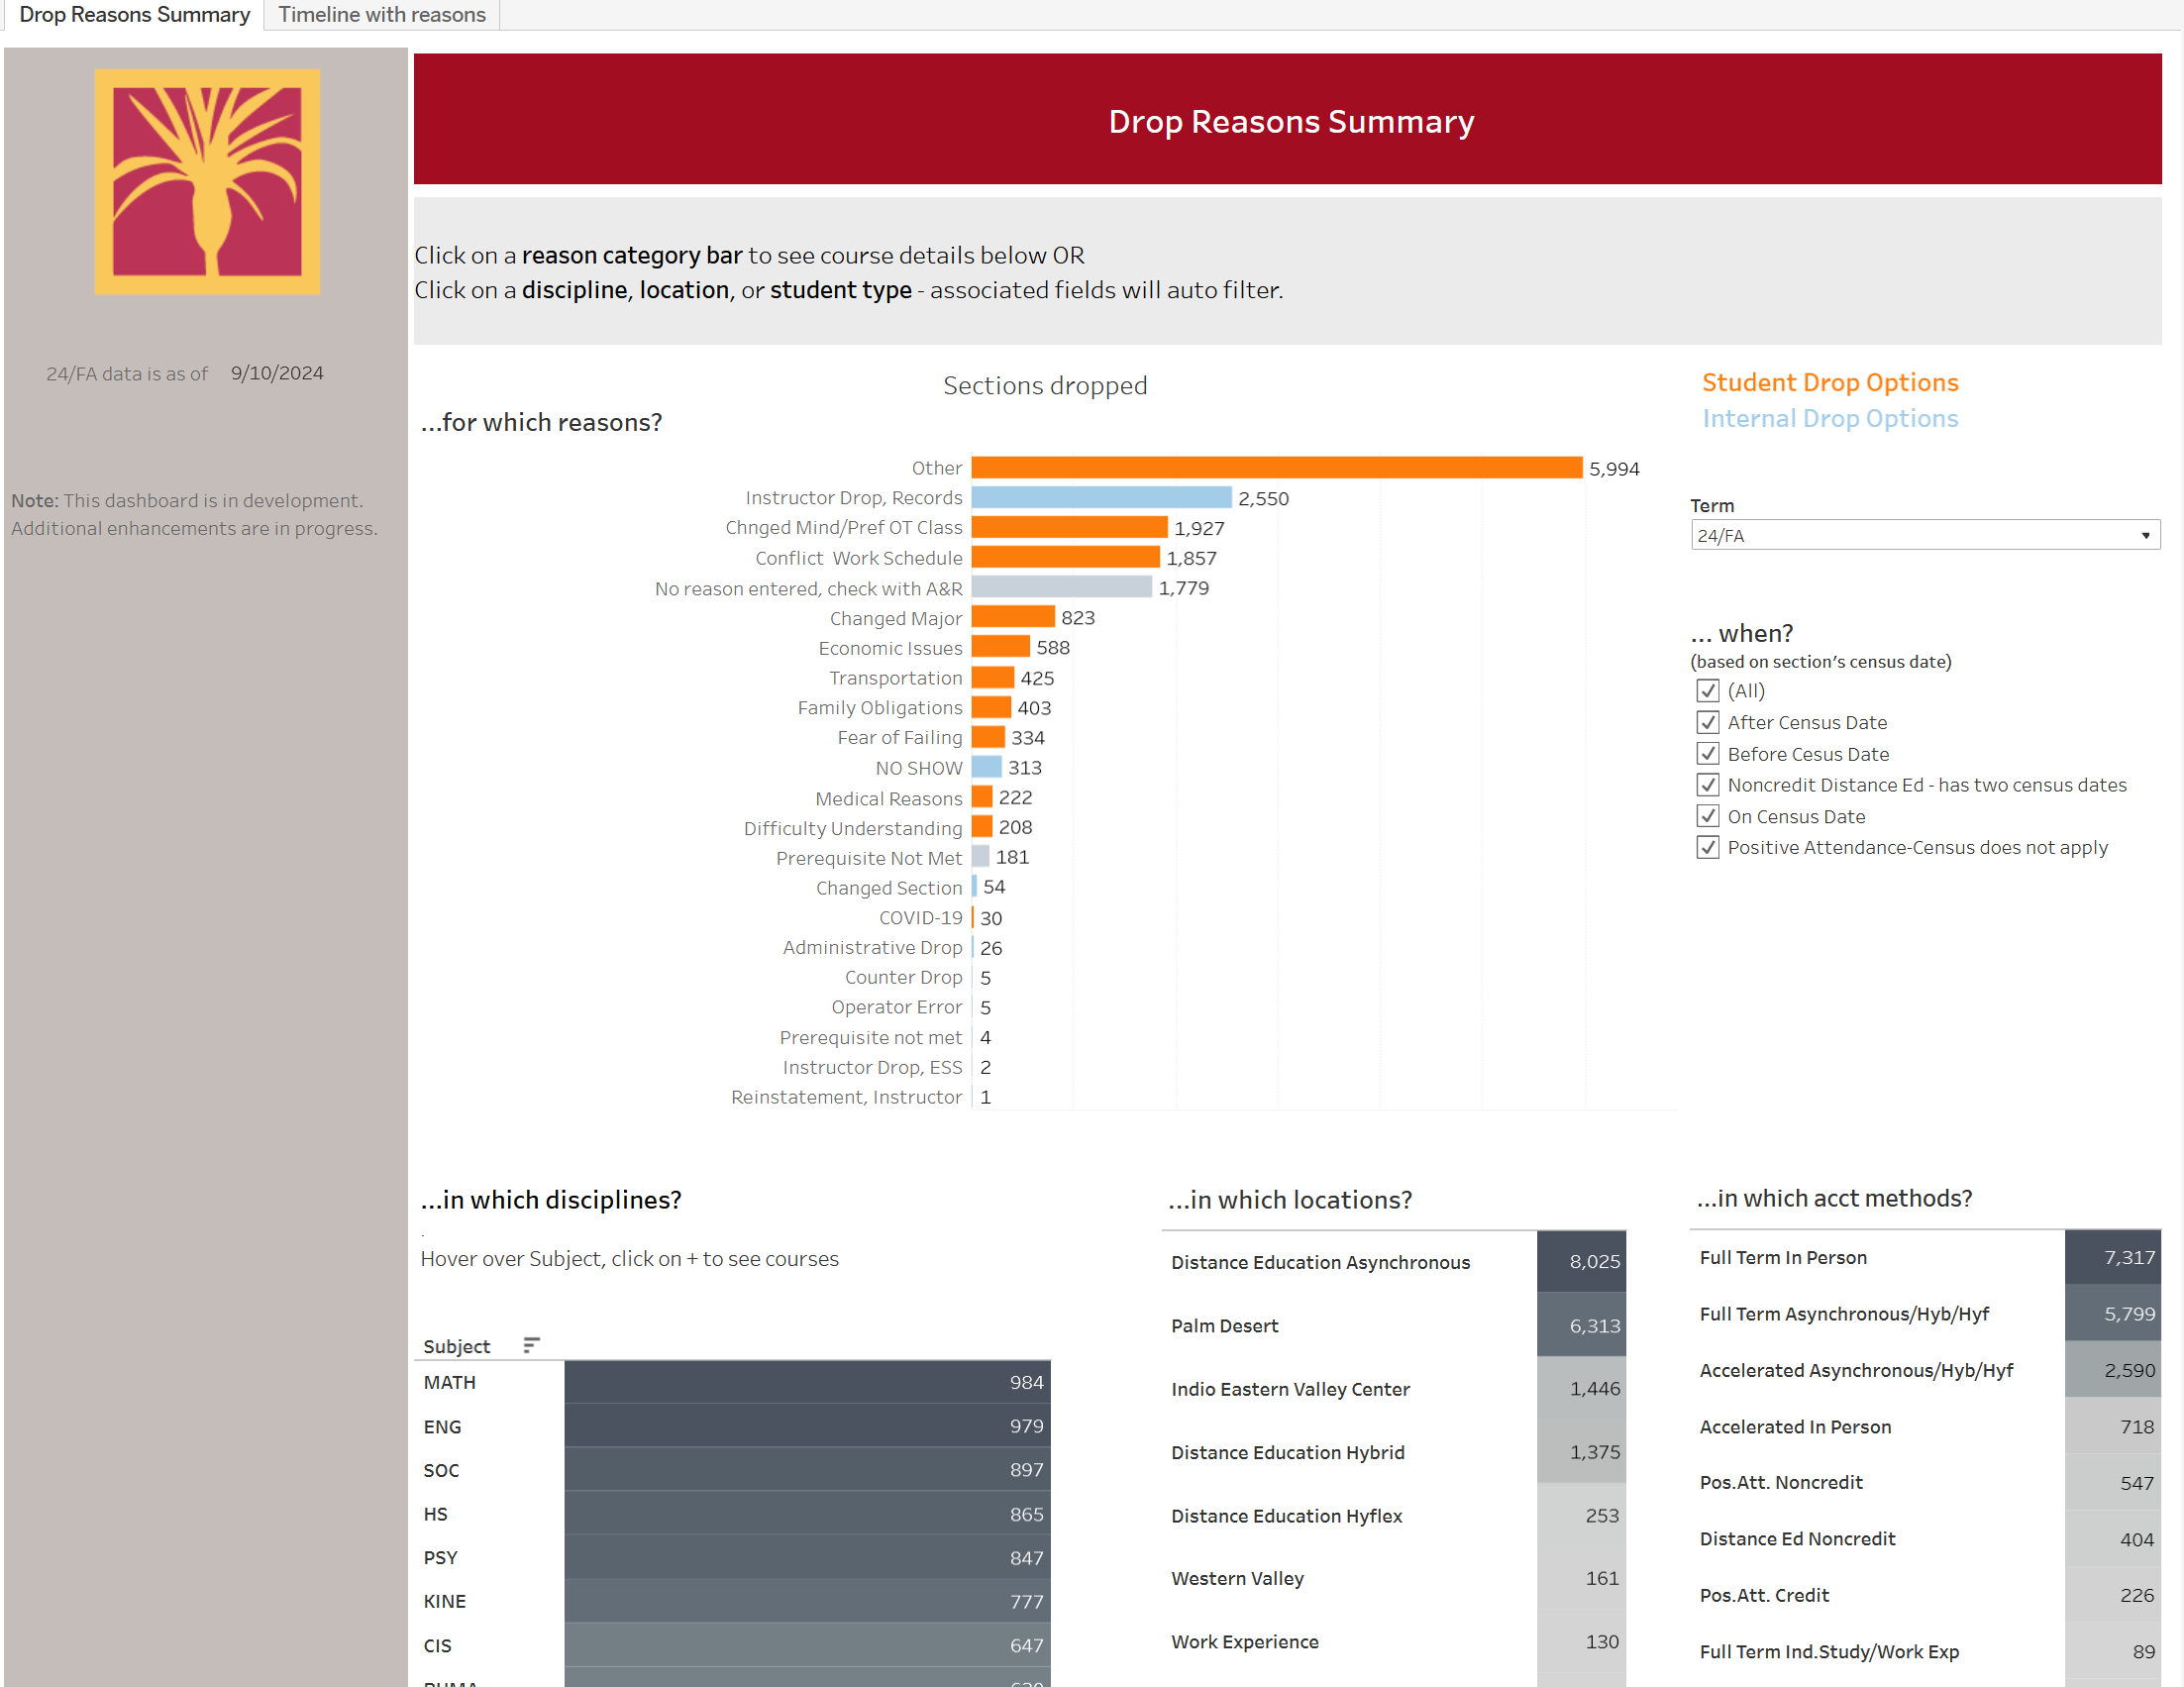
Drop Reasons Interim Dashboard includes reasons students dropped sections or were dropped from sections by administration.
It also includes a timeline with drops in relationship to the first census date.
Program Enhancement Plan (PEP)
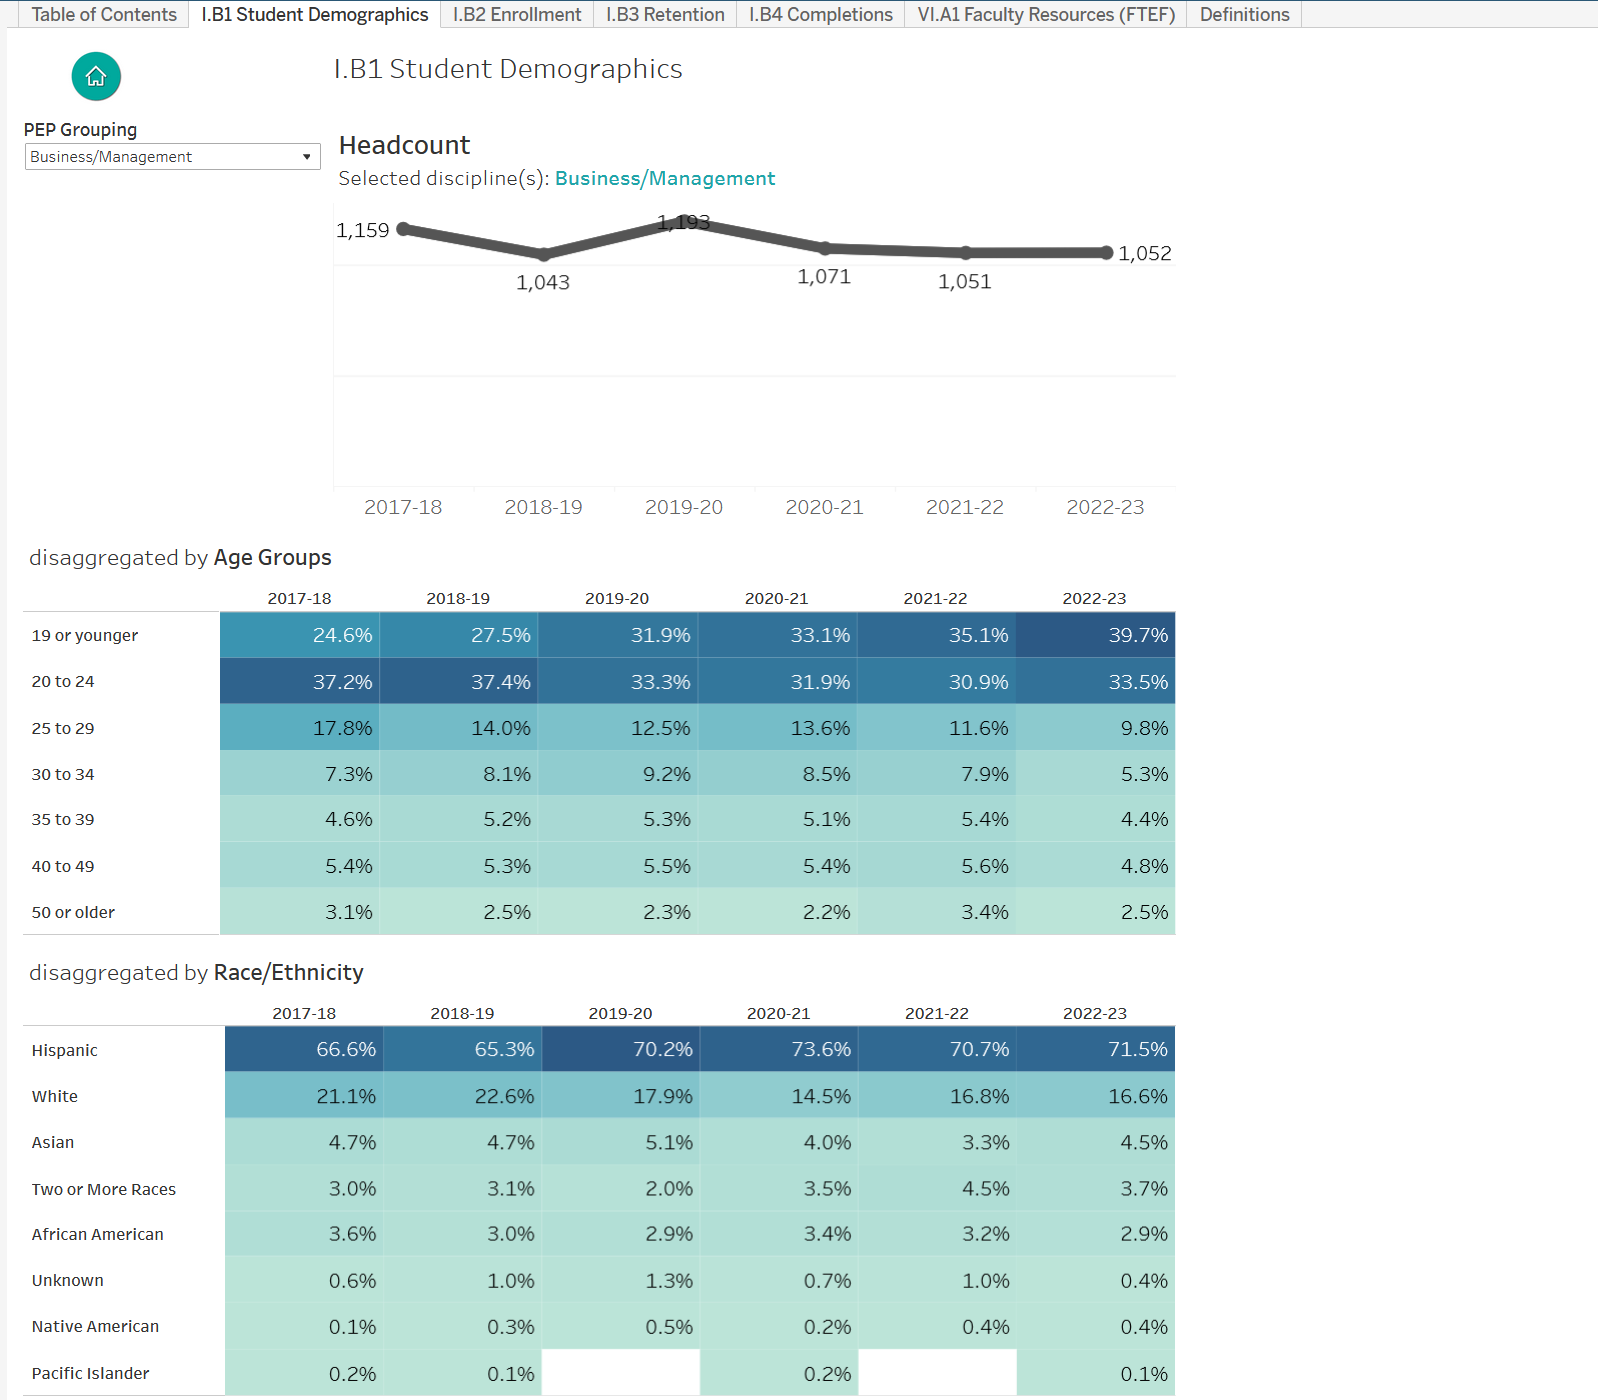
Program Enhancement Plan (PEP) Dashboard includes data aggregated by disciplines in PEP groupings. The dashboard format is
tailored to meet eLumen interface. Student Demographics, Enrollment, Course Outcomes,
Completions, and Faculty Information are included in the dashboard's content.
Transfer-Level Completion Rates in Math and English
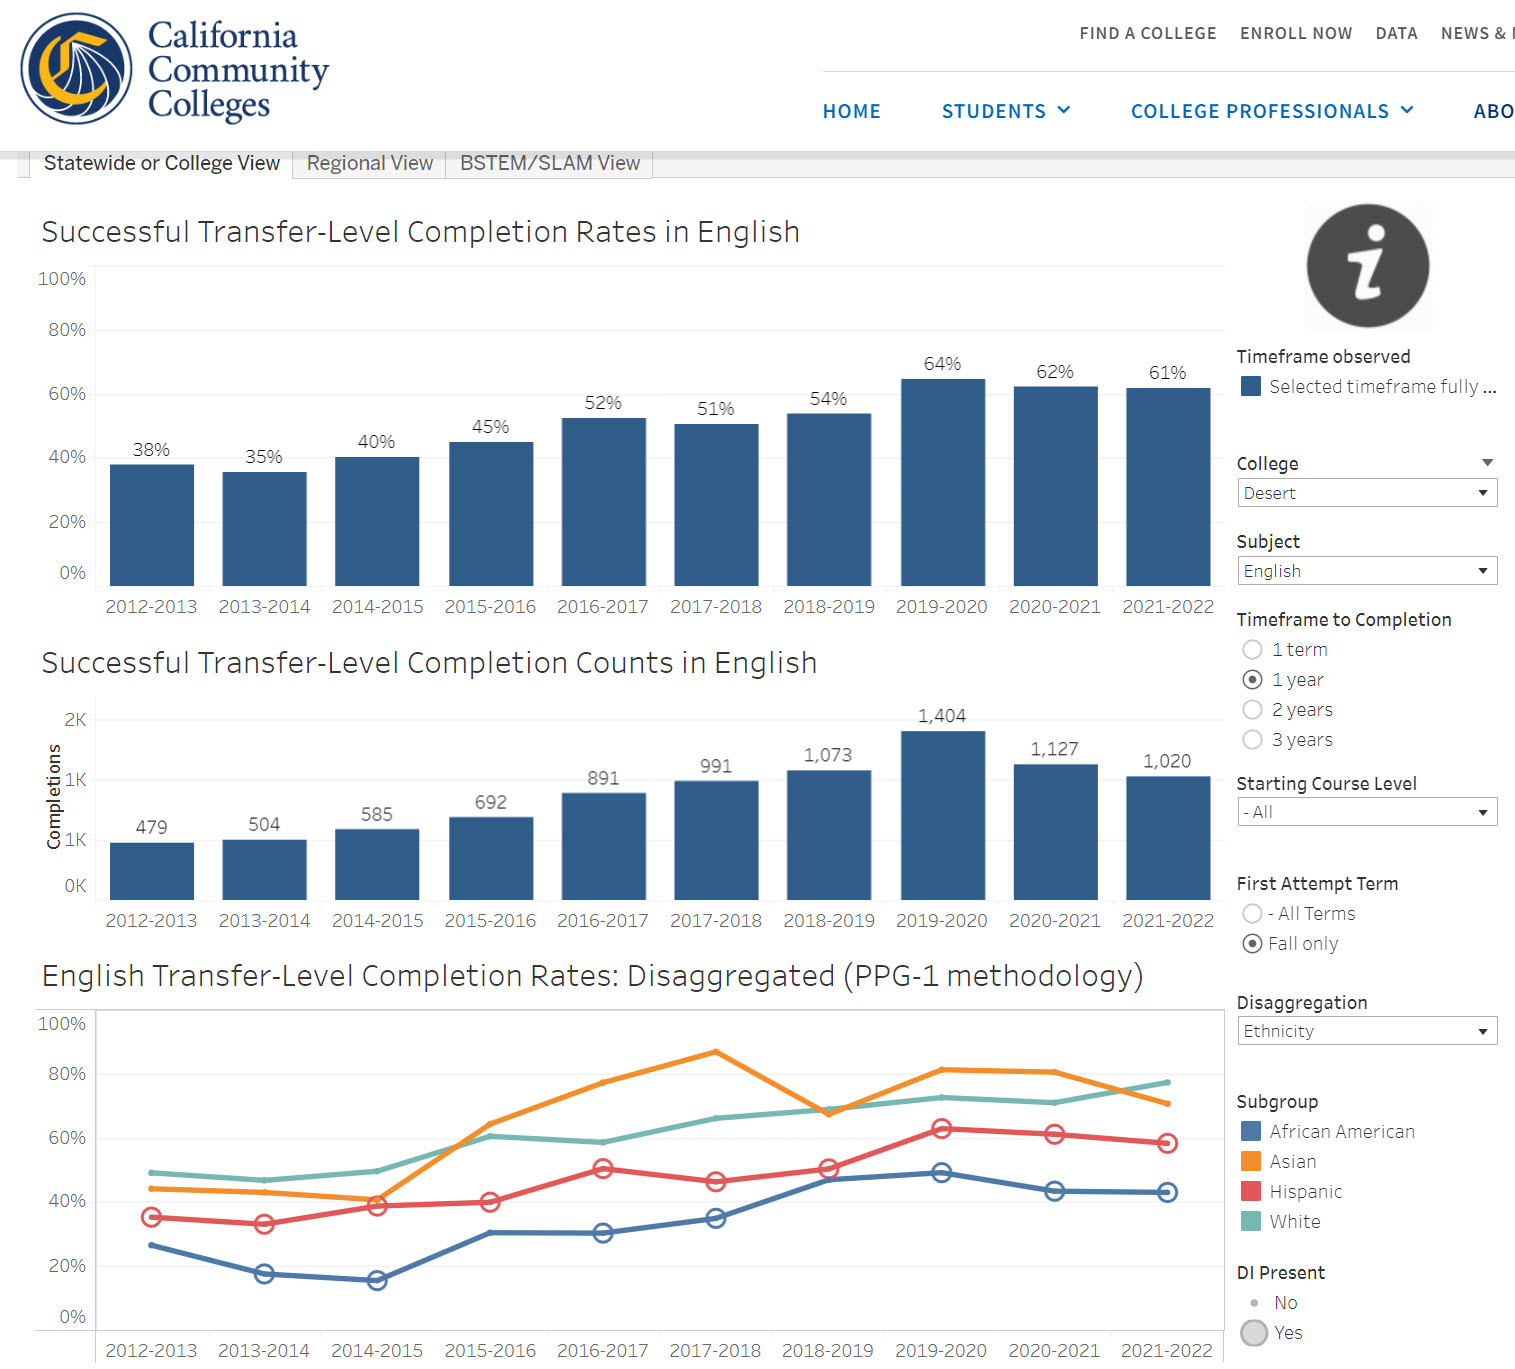
Transfer-Level Completion Rates in Math and English are available on California Community Colleges Chancellor's Website. Select "Desert"
under the College filter on the top right side.
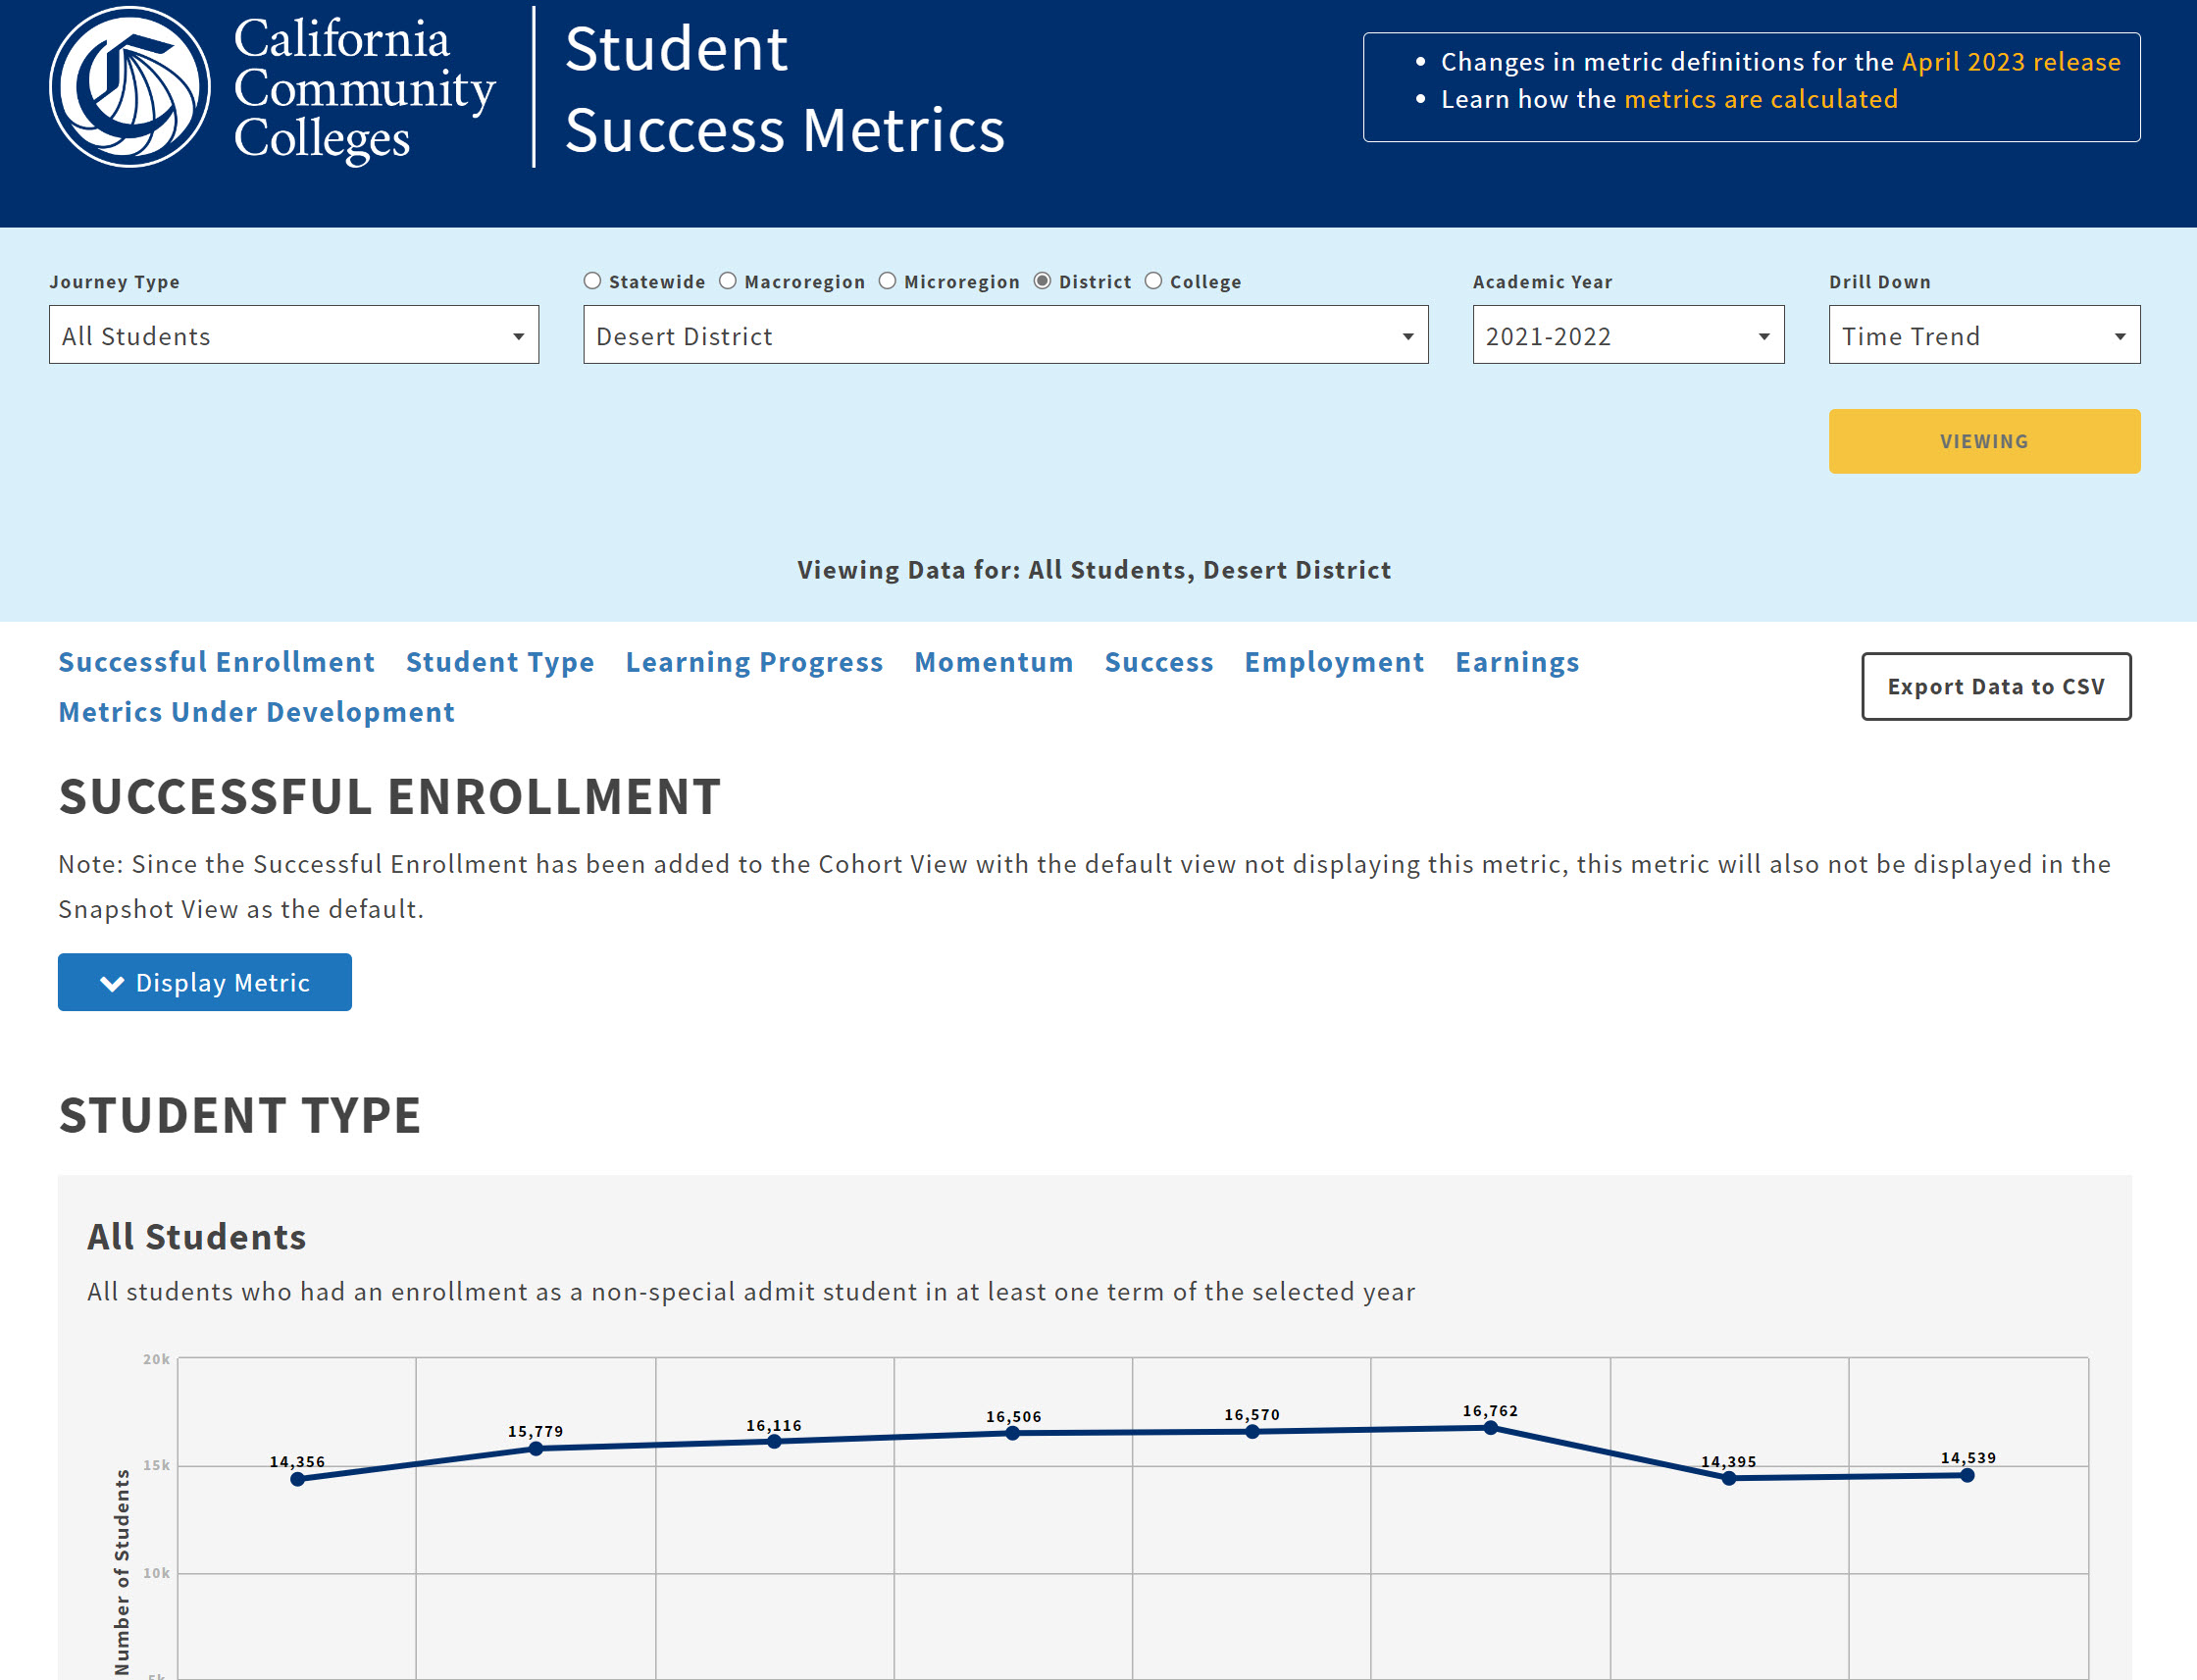
Student Success Metrics - California Community Colleges Chancellor's Office
Student Success Metrics are available on California Community Colleges Chancellor's Website. Select "Desert
District" at the top and then select refresh to view College of the Desert data.
Archived Dashboards
The following archived dashboards are being reviewed for rebuild and updating. If
immediate data is needed from these dashboards, please complete a Research Request.
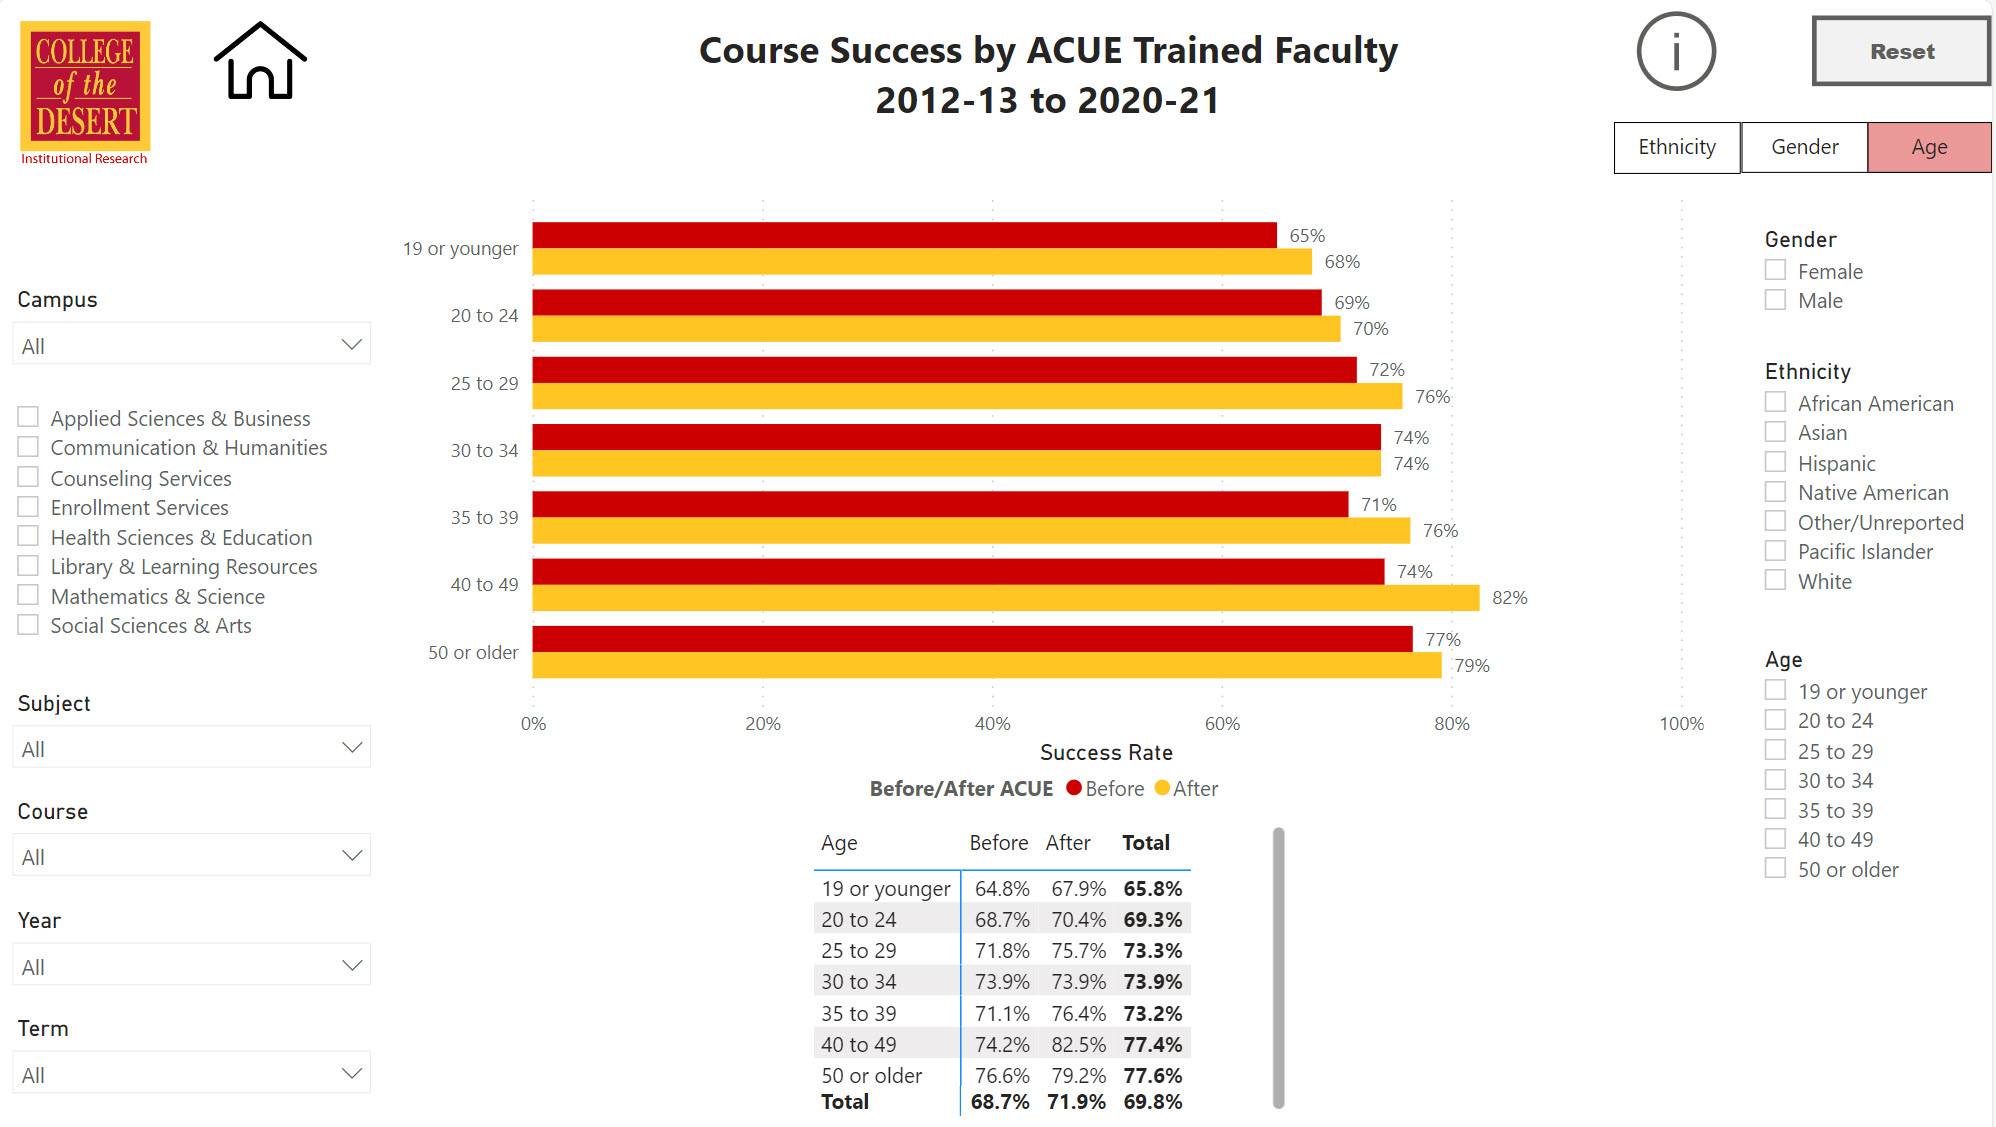
Course Success by ACUE Trained Faculty from 2012-13 to 2020-21 is on page 3 of this dashboard. This dashboard is being updated.
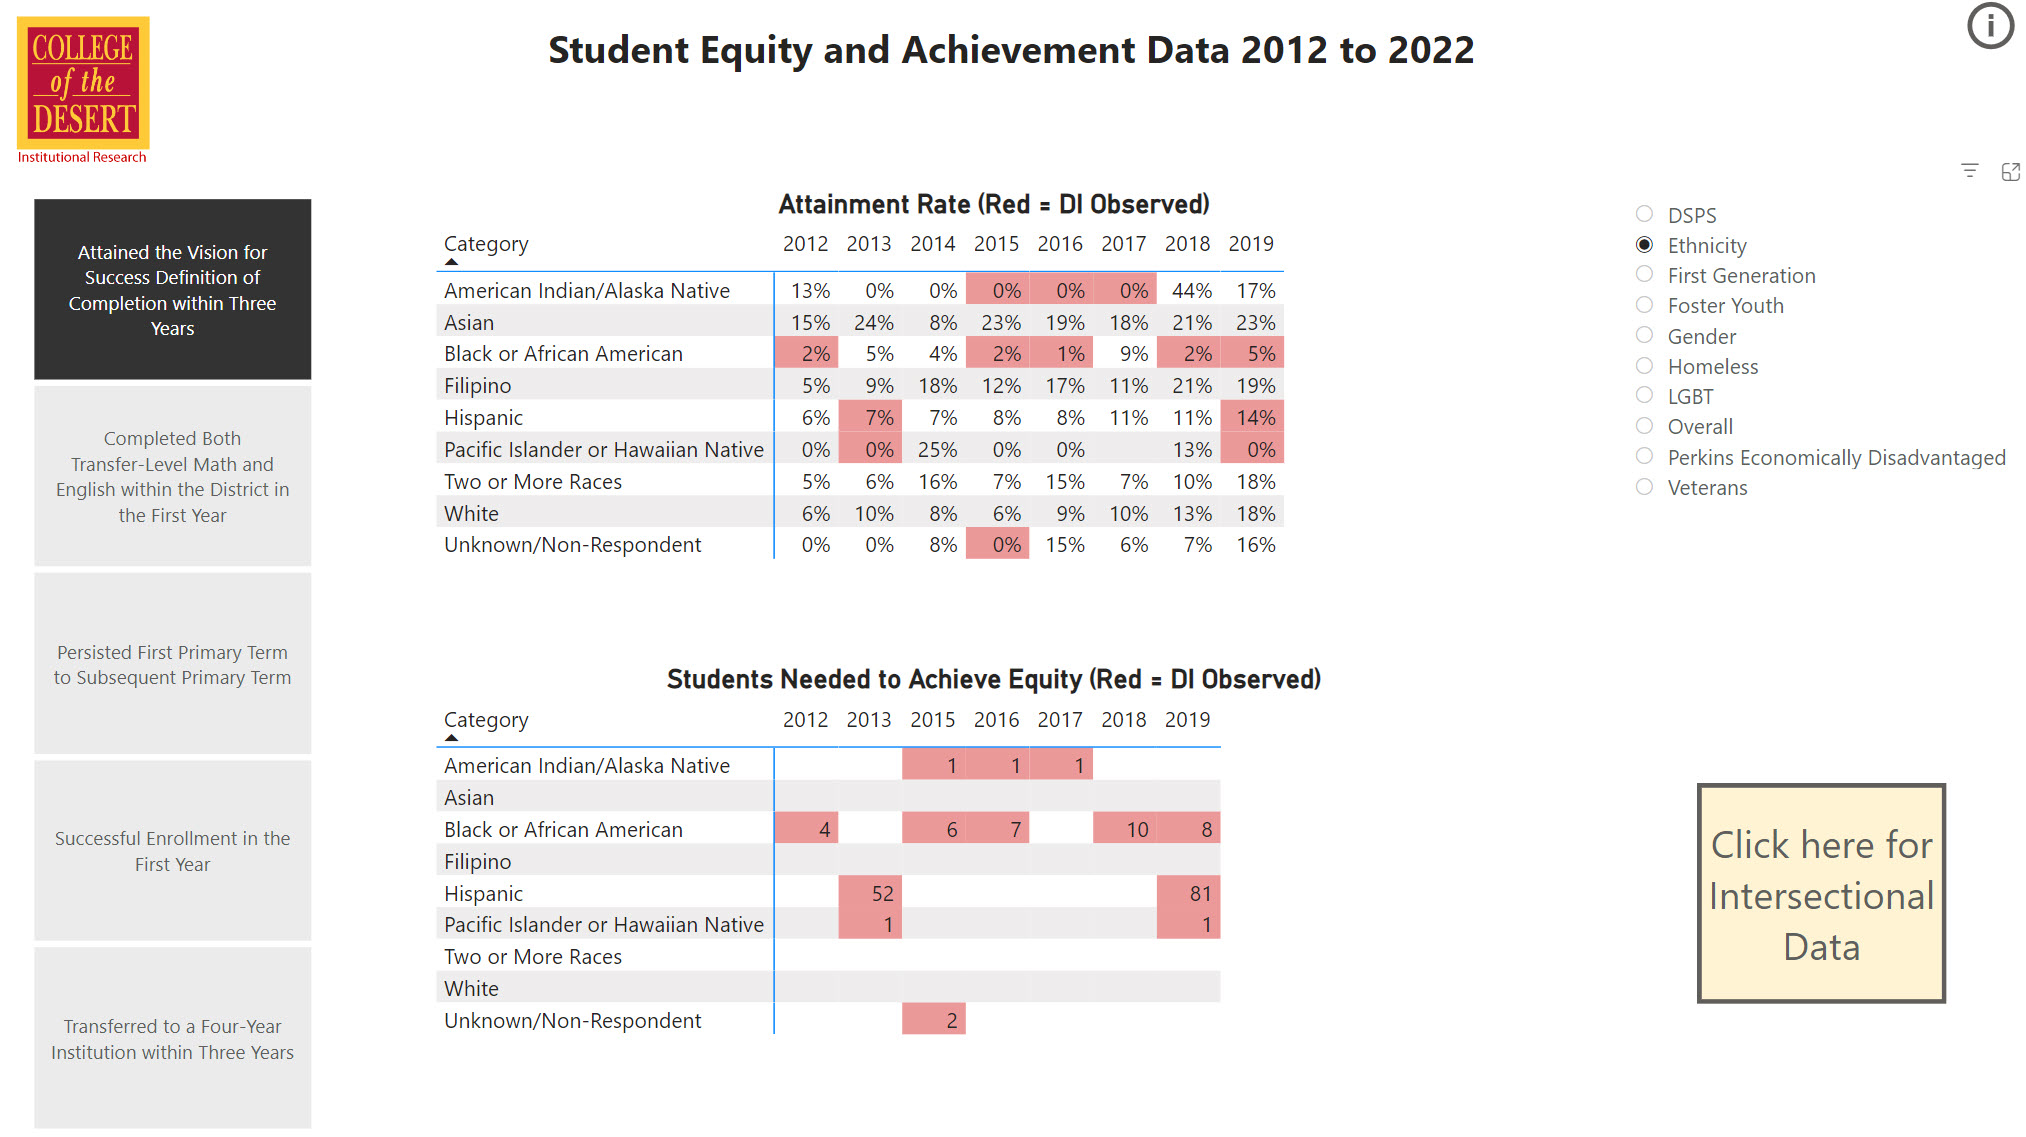
Student Equity and Achievement Data includes disproportionate impact data from 2012 to 2022. This dashboard is being
updated.
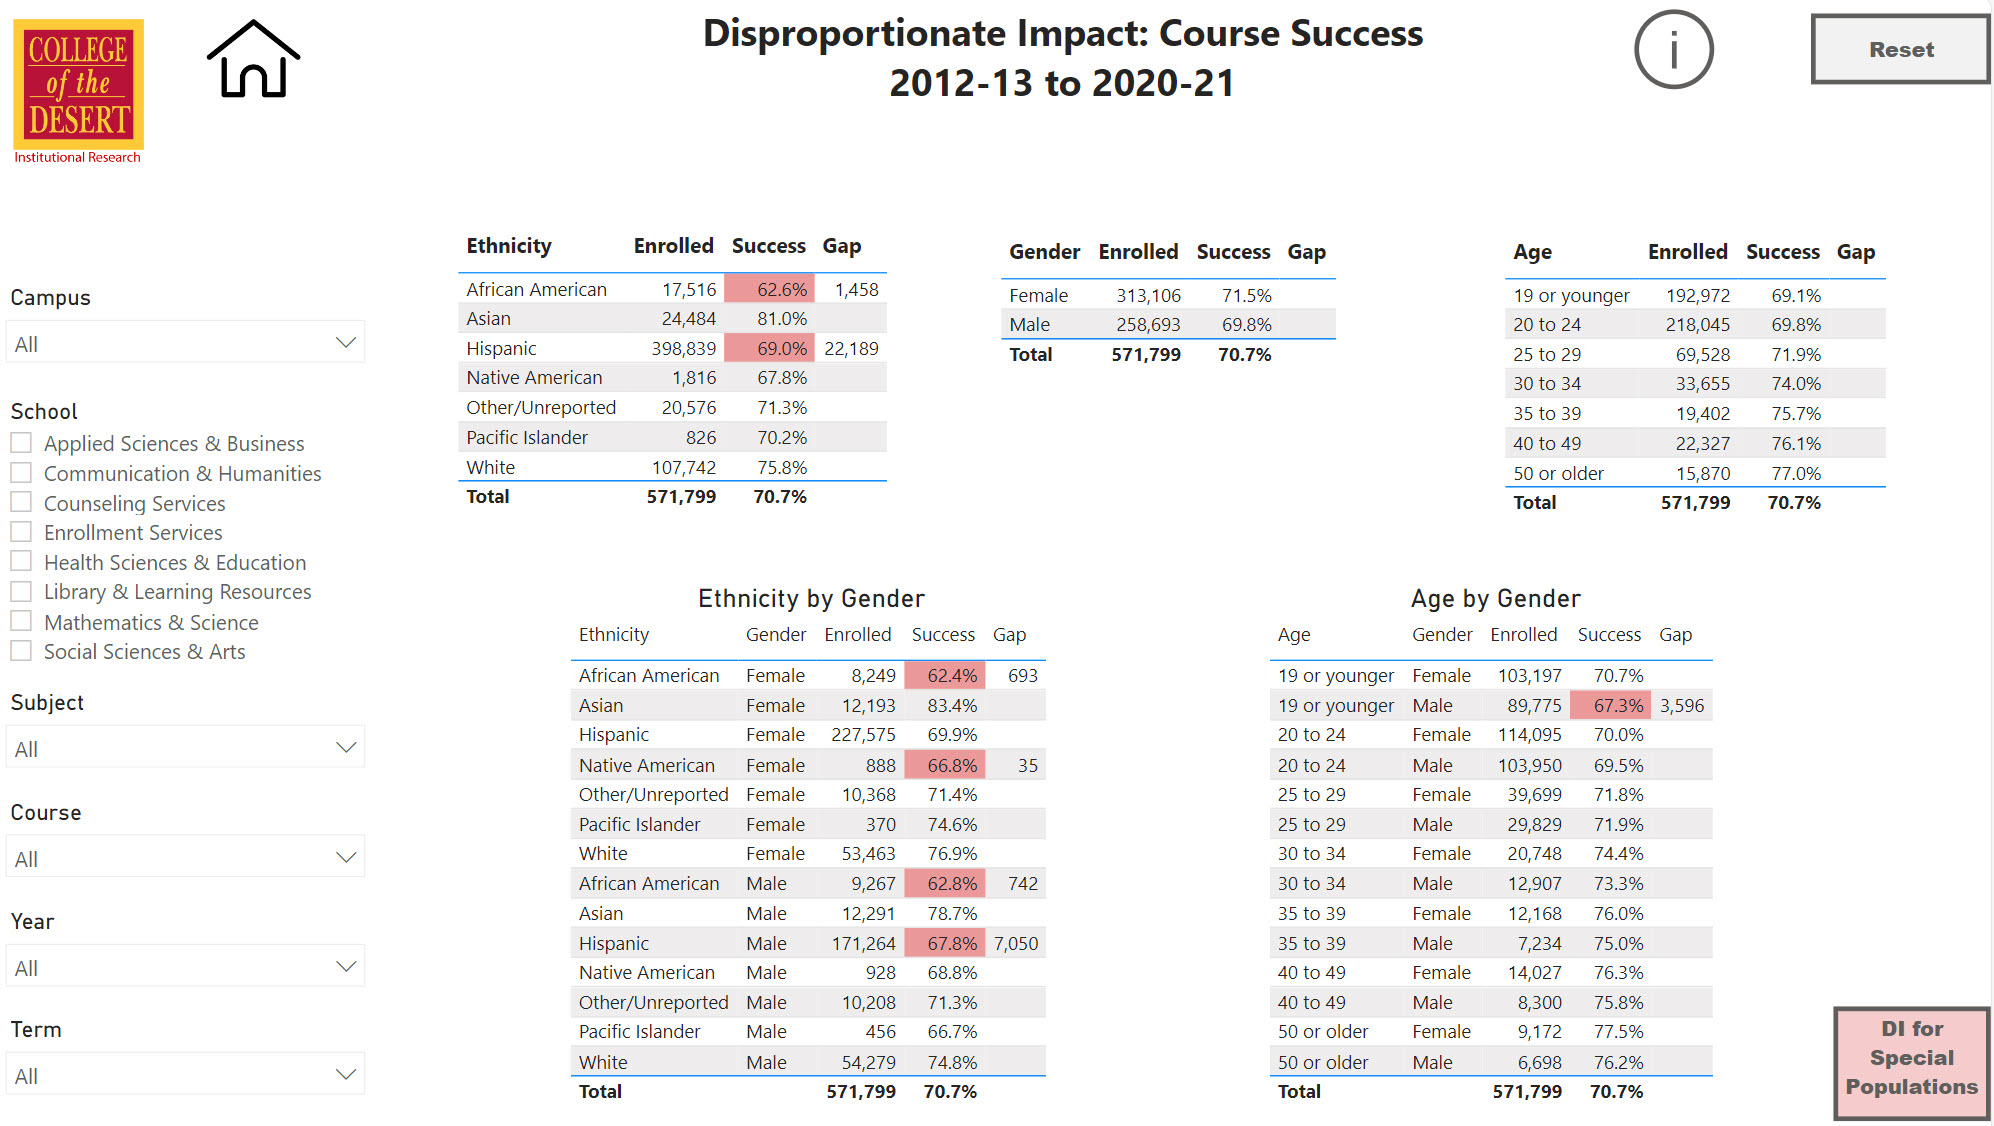
Disproportionate Impact in Course Success and Retention starts on page 4. This dashboard is being updated.
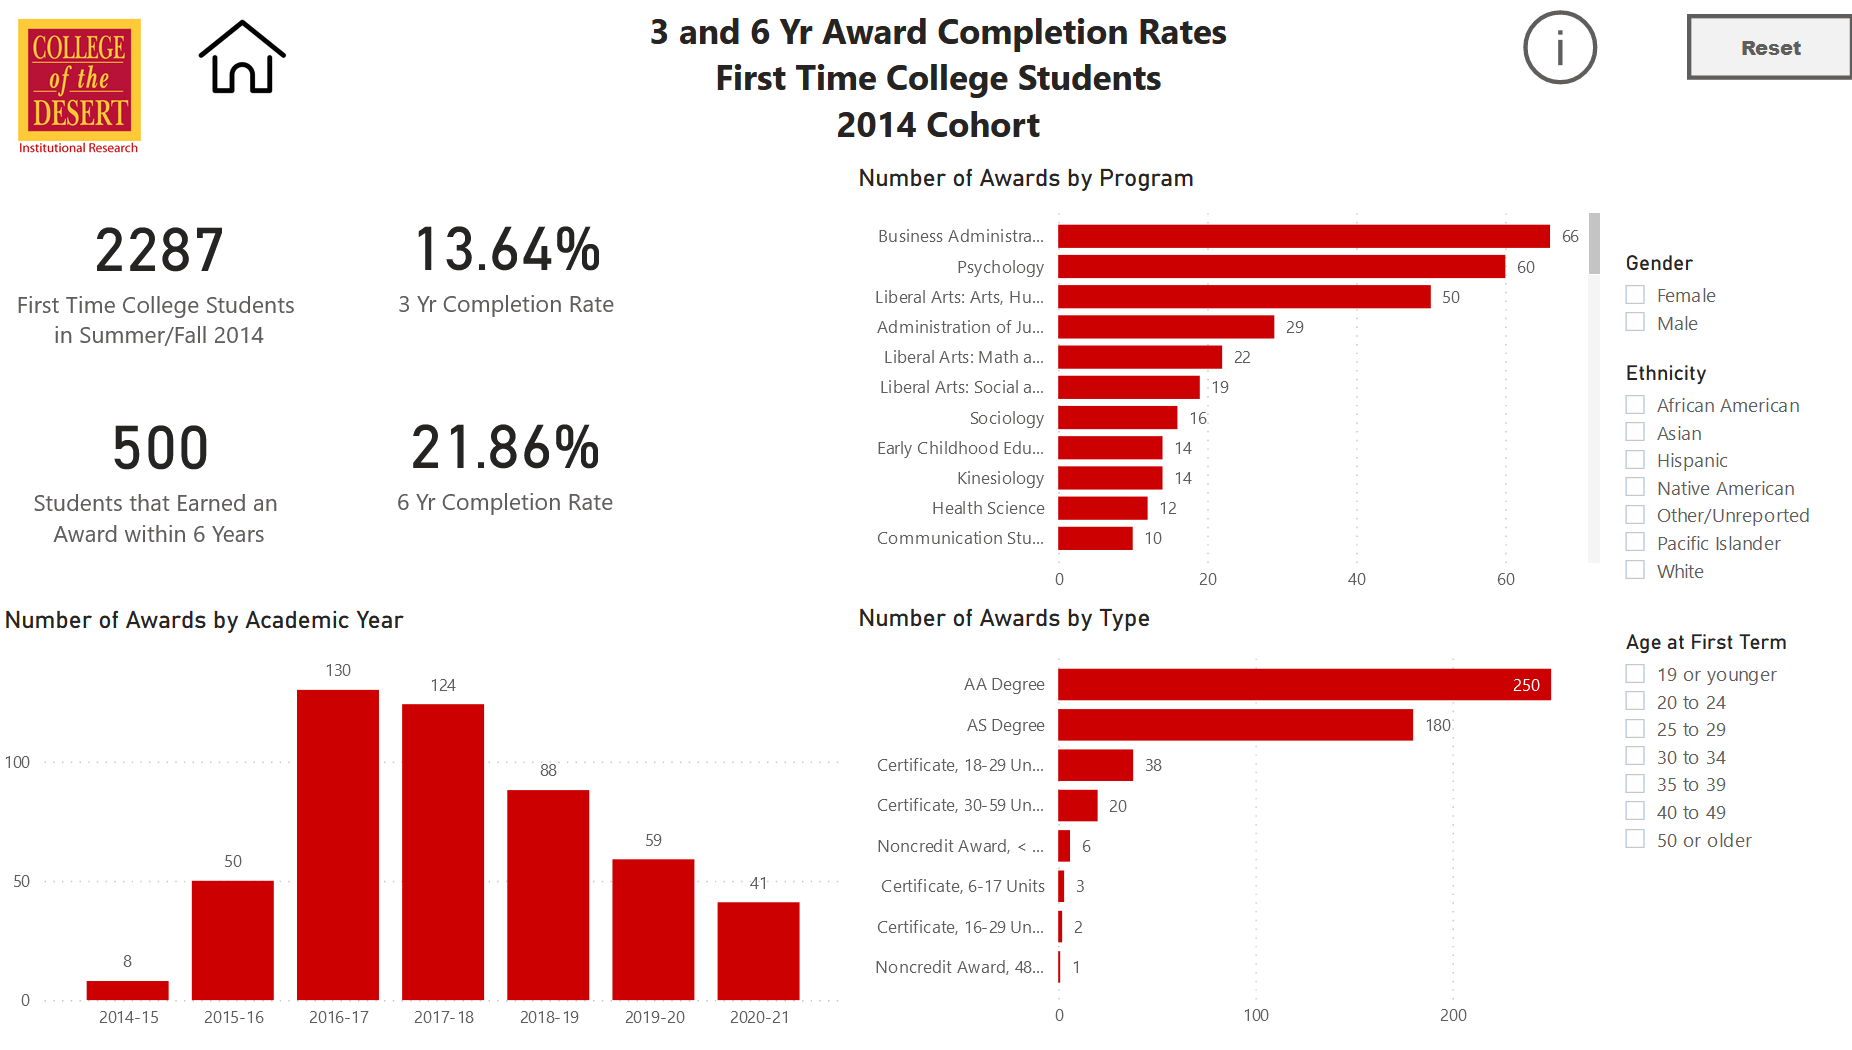
First Time College Students: 3 and 6 Year Award Completion Rates utilizes the 2014 cohort and disaggregates data by programs, award type, and student
demographics. This dashboard is in queue for update.
Demographics
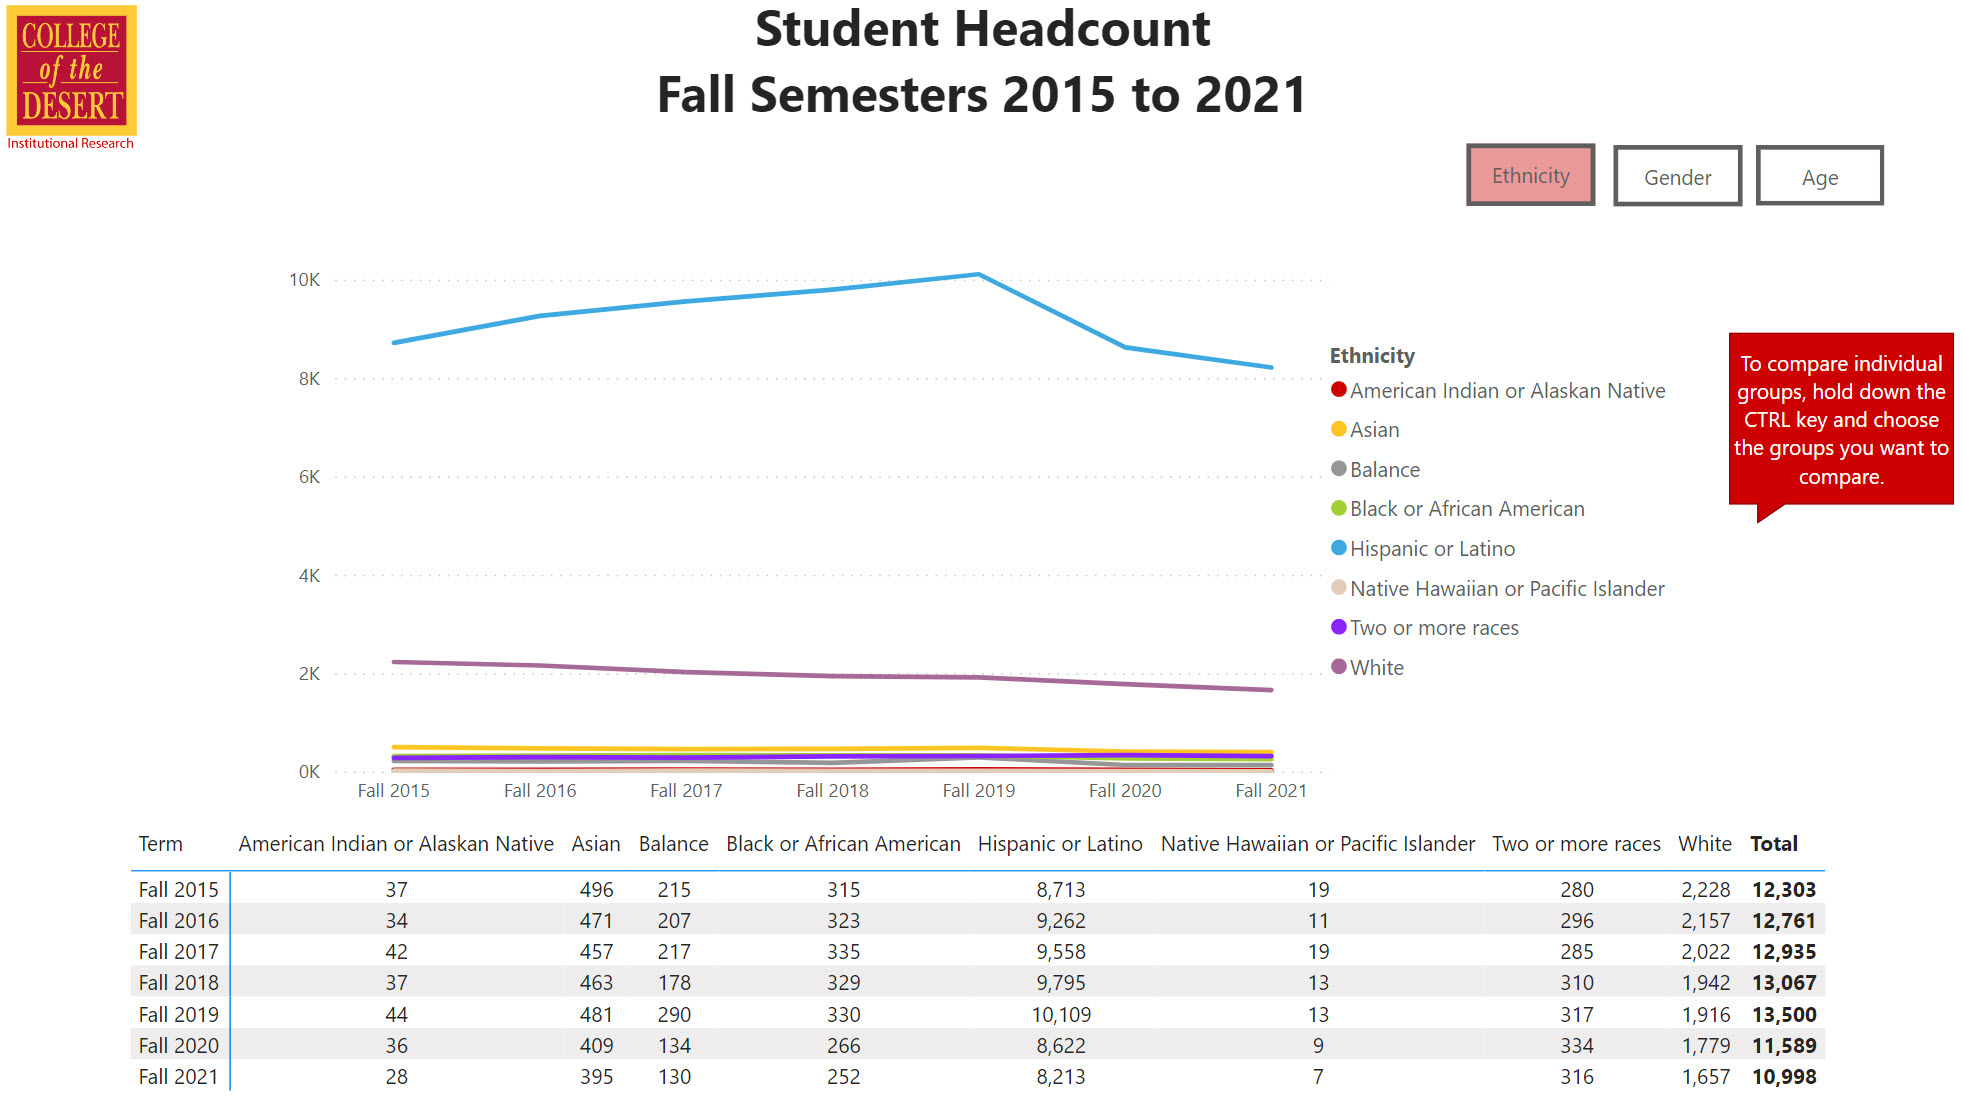
Student Demographics Dashboard includes data from fall 2015 to fall 2021. This dashboard is being updated. Please
visit
CCCCO Datamart for most up to date data.
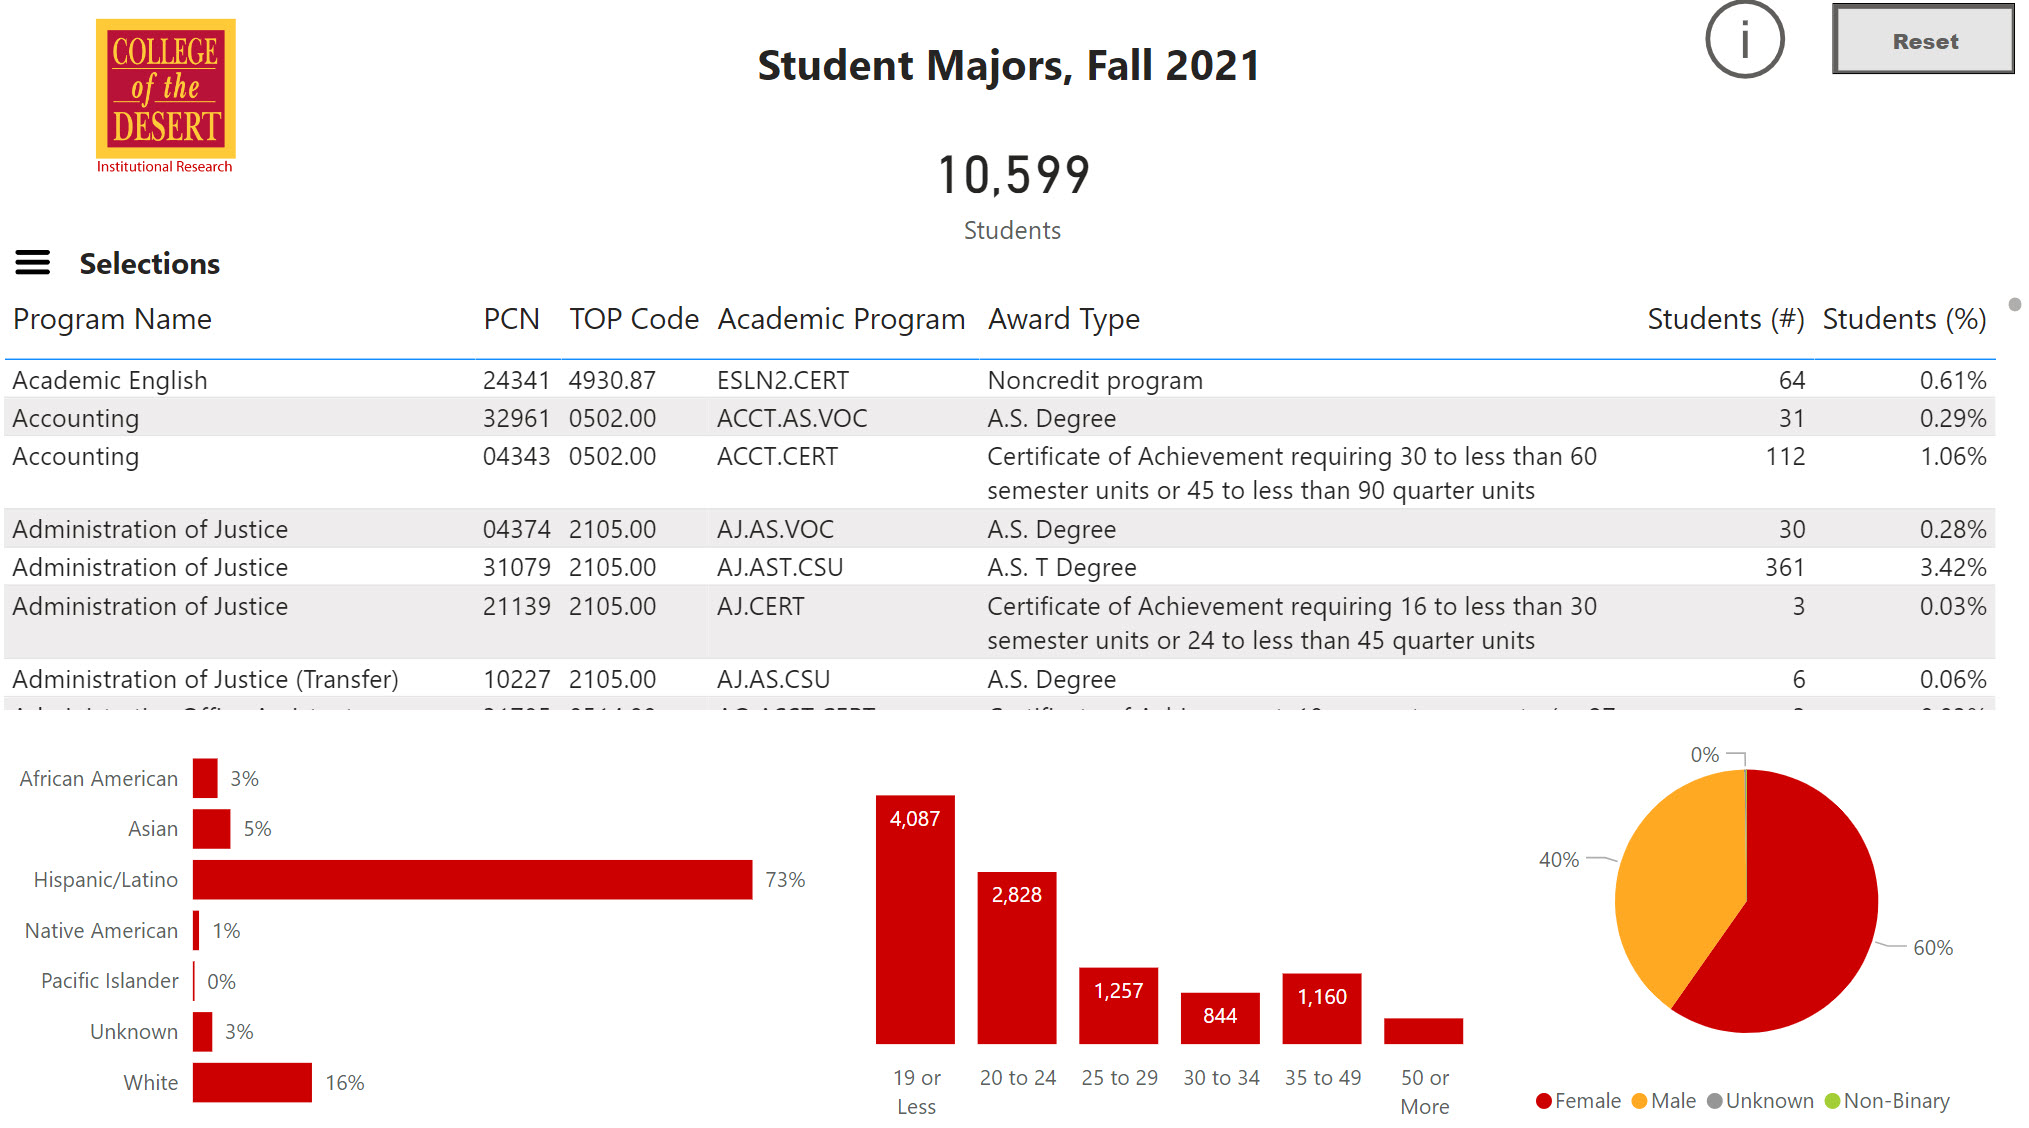
Student Majors at Census data is as off fall 2021 is disaggregated by student demographics. This dashboard
is being updated.
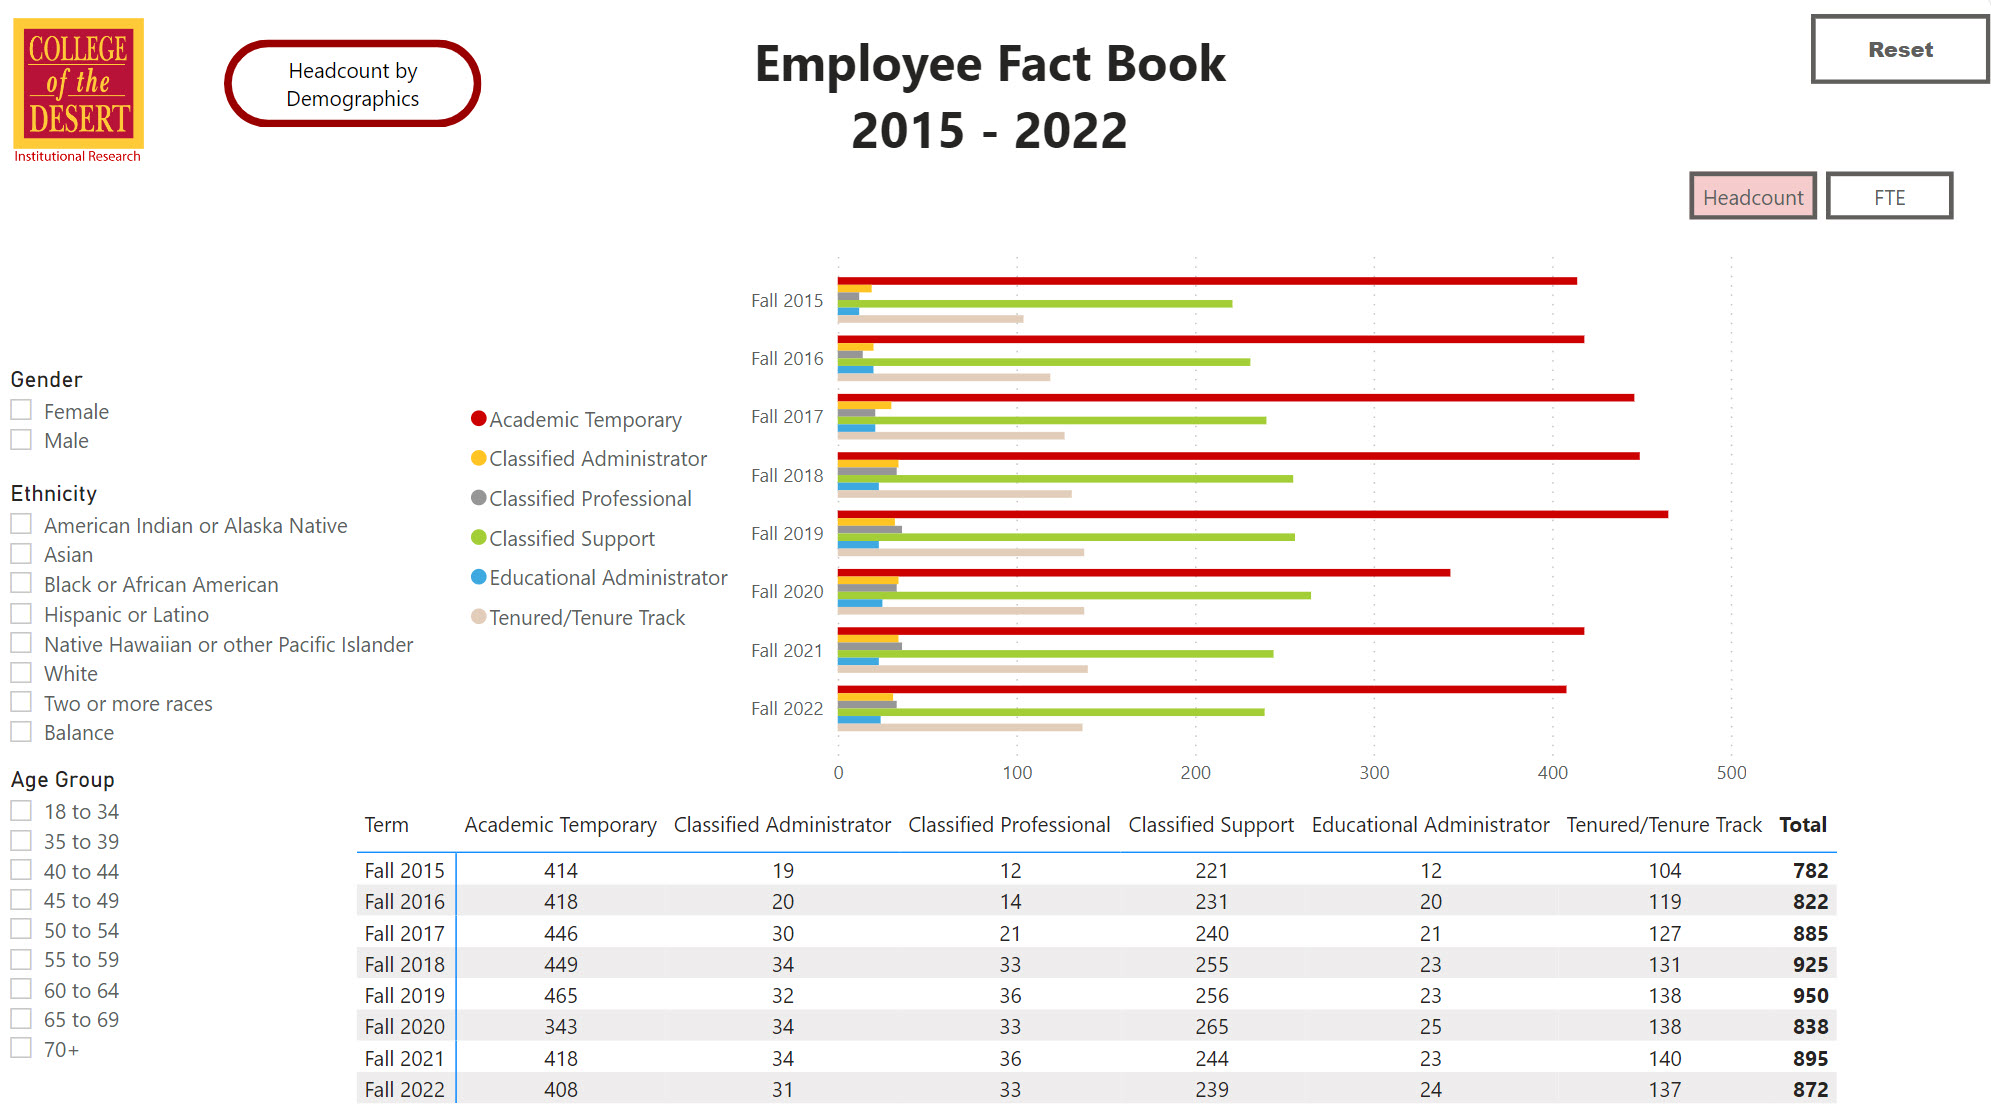
Employee Demographics Dashboard includes data from fall 2015 to fall 2021. This dashboard is being updated.
Employment
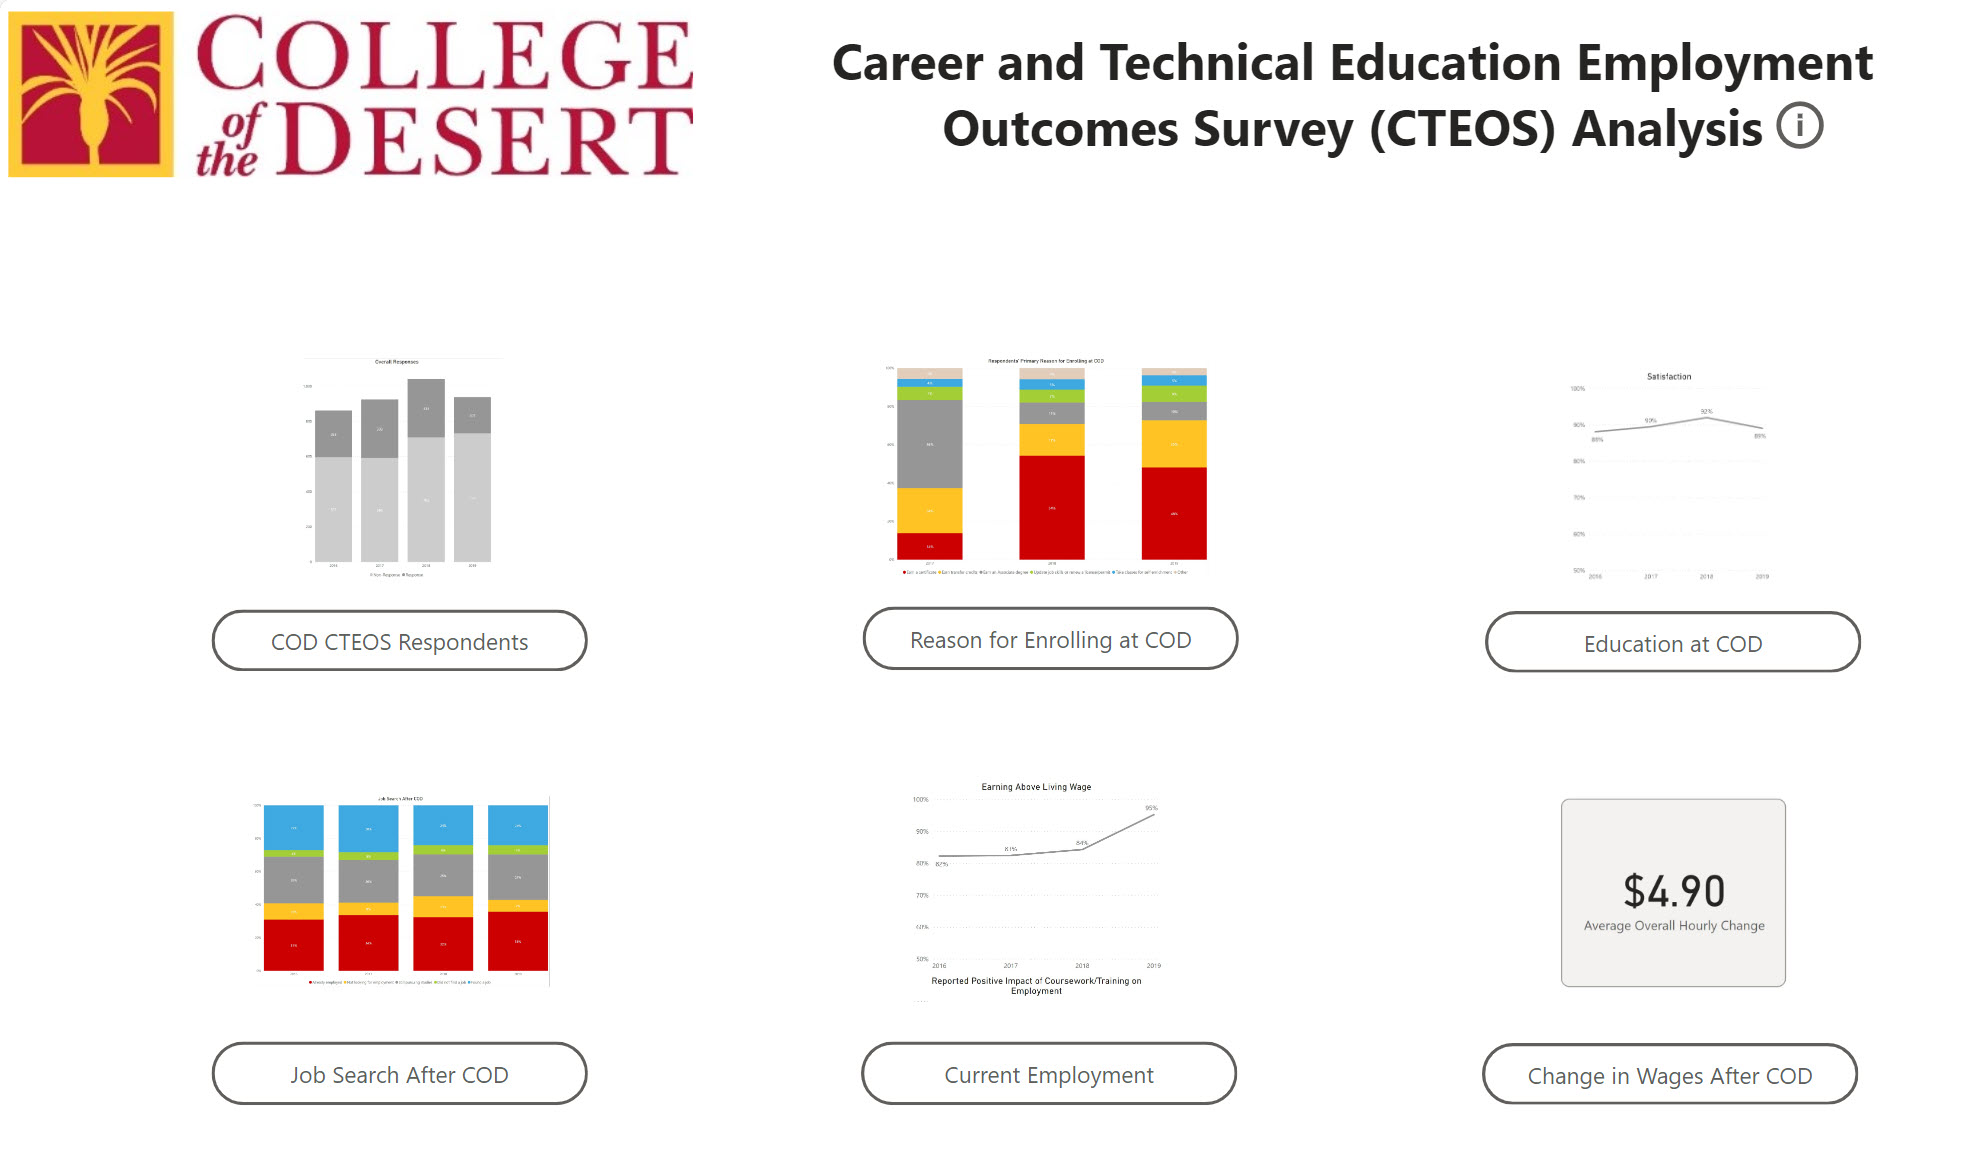
Career Technical Education Employment Outcomes Survey (CTEOS) Analysis includes data through 2019. This dashboard is being updated.
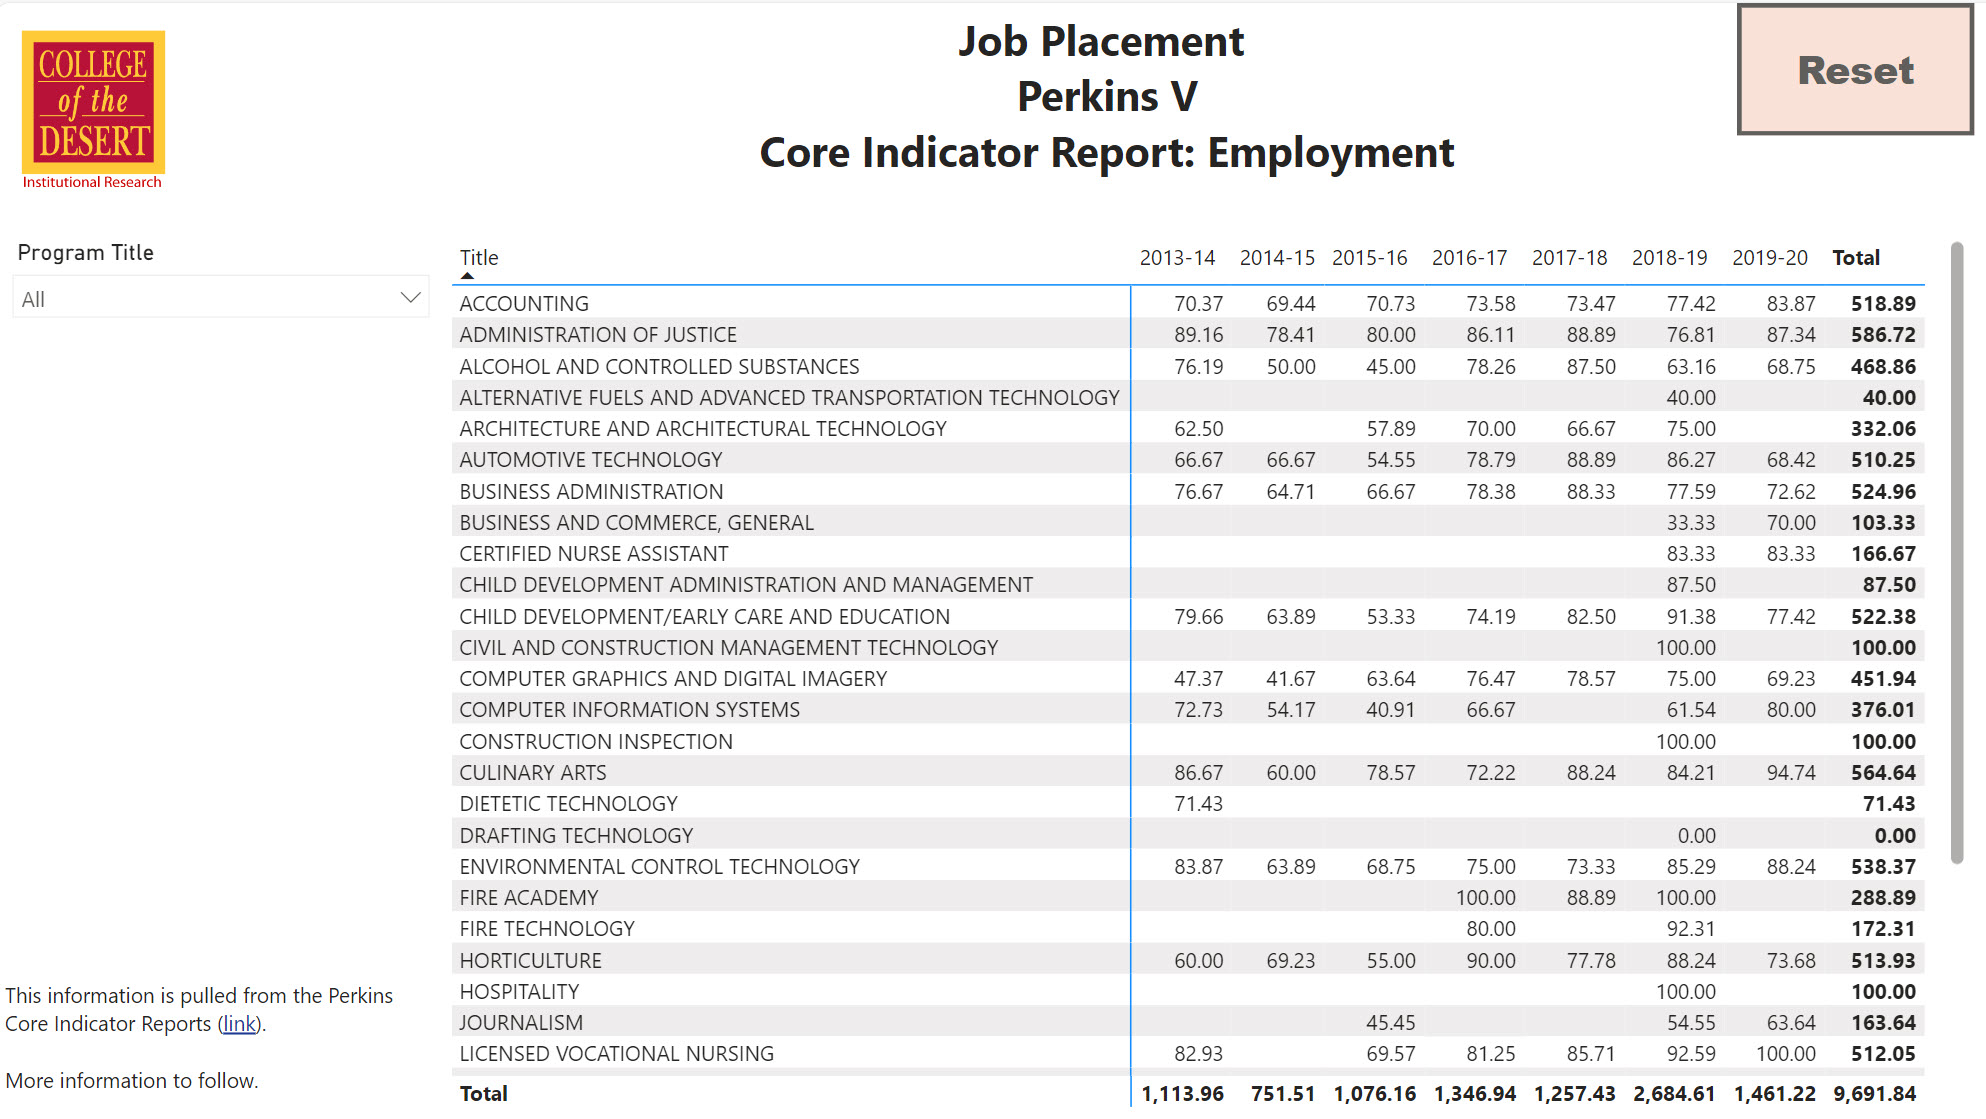
Job Placement Perkins V, Core Indicator Report for Employment includes data through 2019-20. This dashboard is being updated. Meanwhile, visit
CCCCO CTE Datamart for most up to date data.
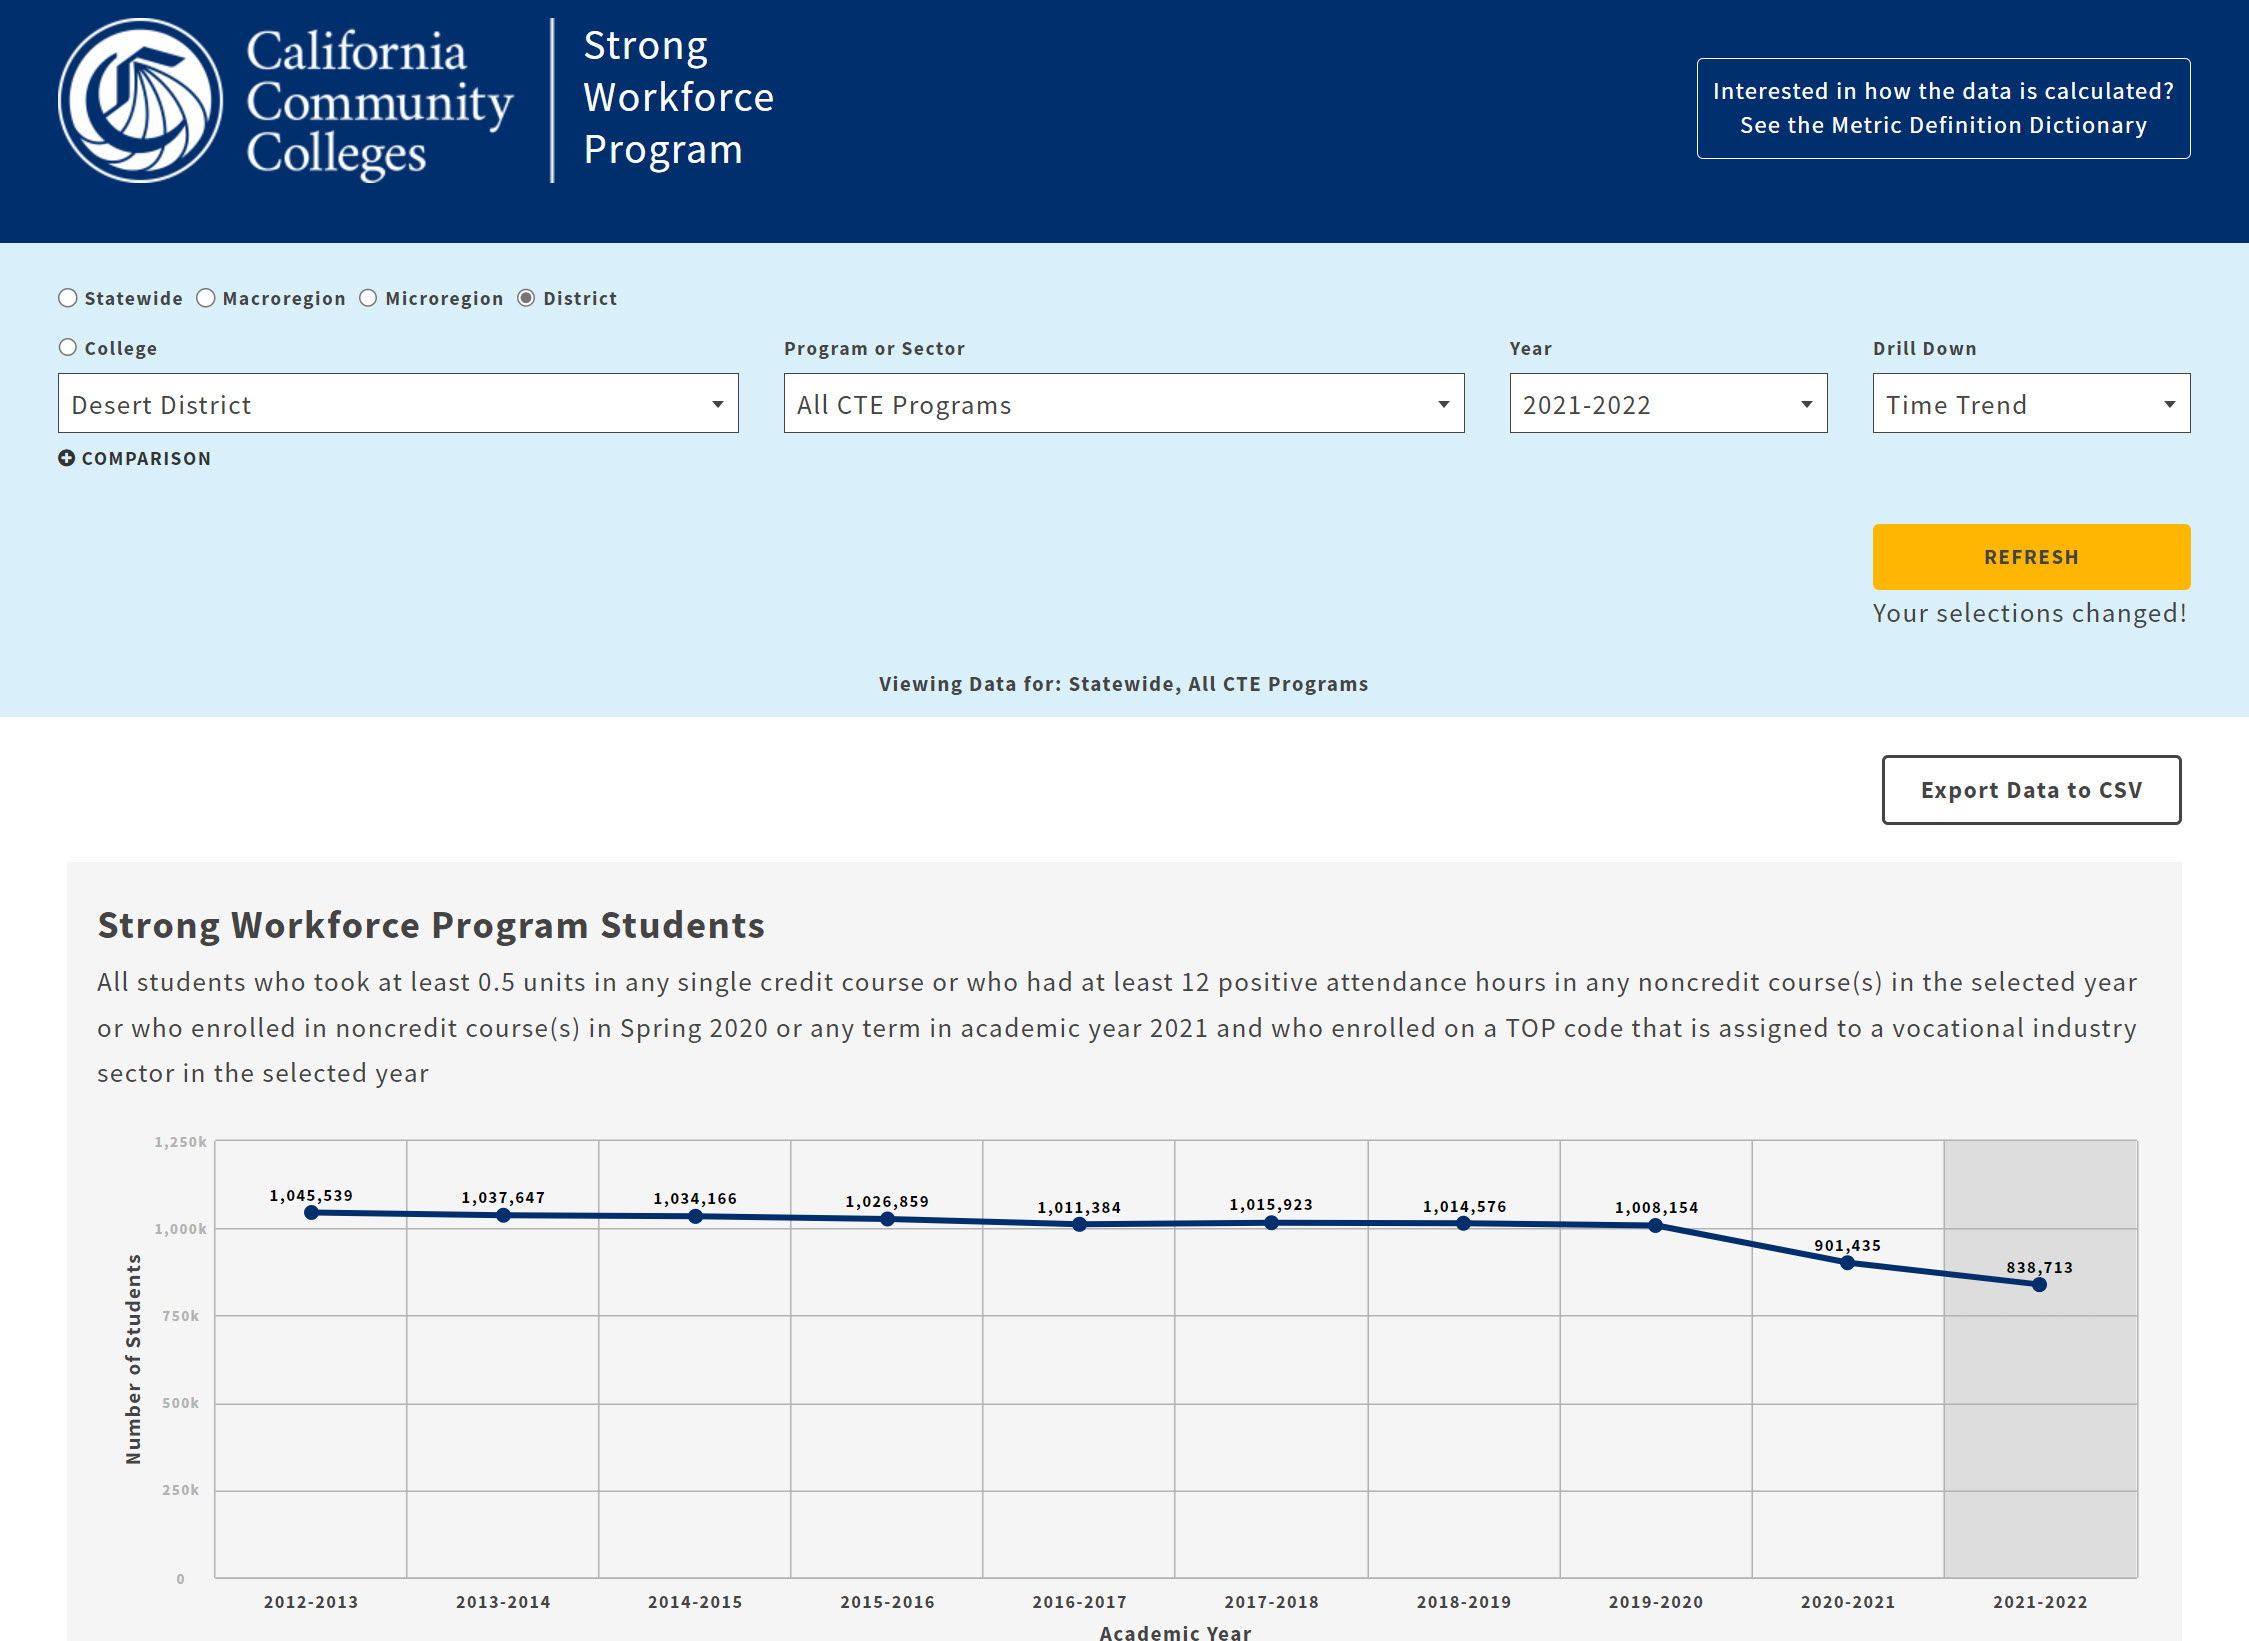
Strong Workforce Program Employment - California Community Colleges Chancellor's Office
Strong Workforce Program Employment data is available on California Community Colleges Chancellor's Website. Select "Desert
District" at the top and then select refresh to view College of the Desert data.
Environmental Scan - Coachella Valley
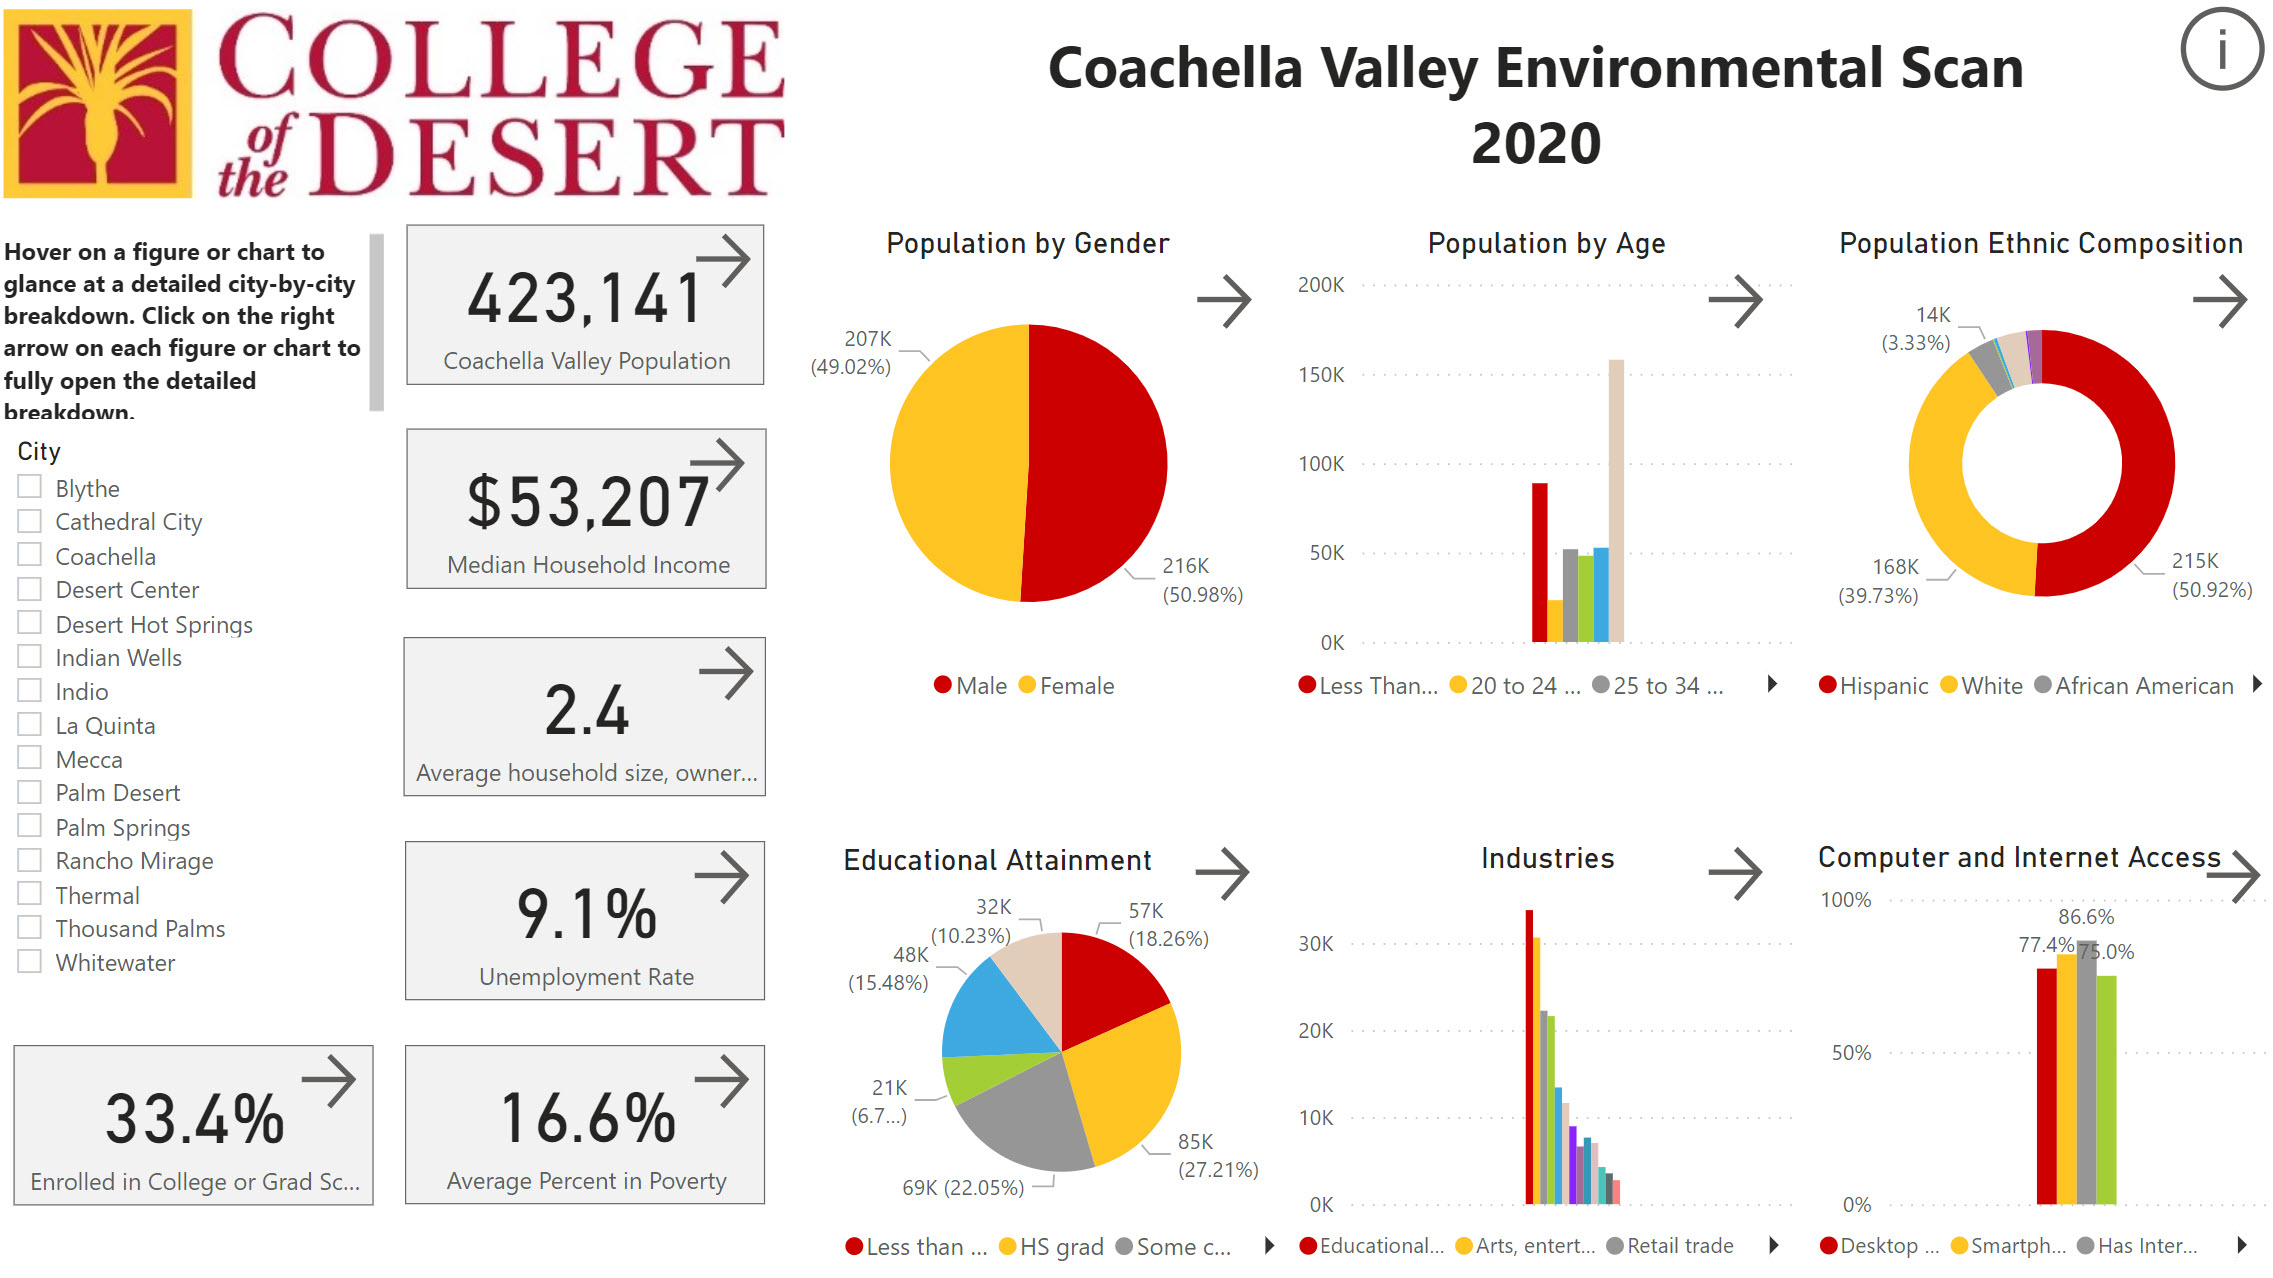
Coachella Valley Environmental Scan Dashboard includes data from 2020. This dashboard is being updated.
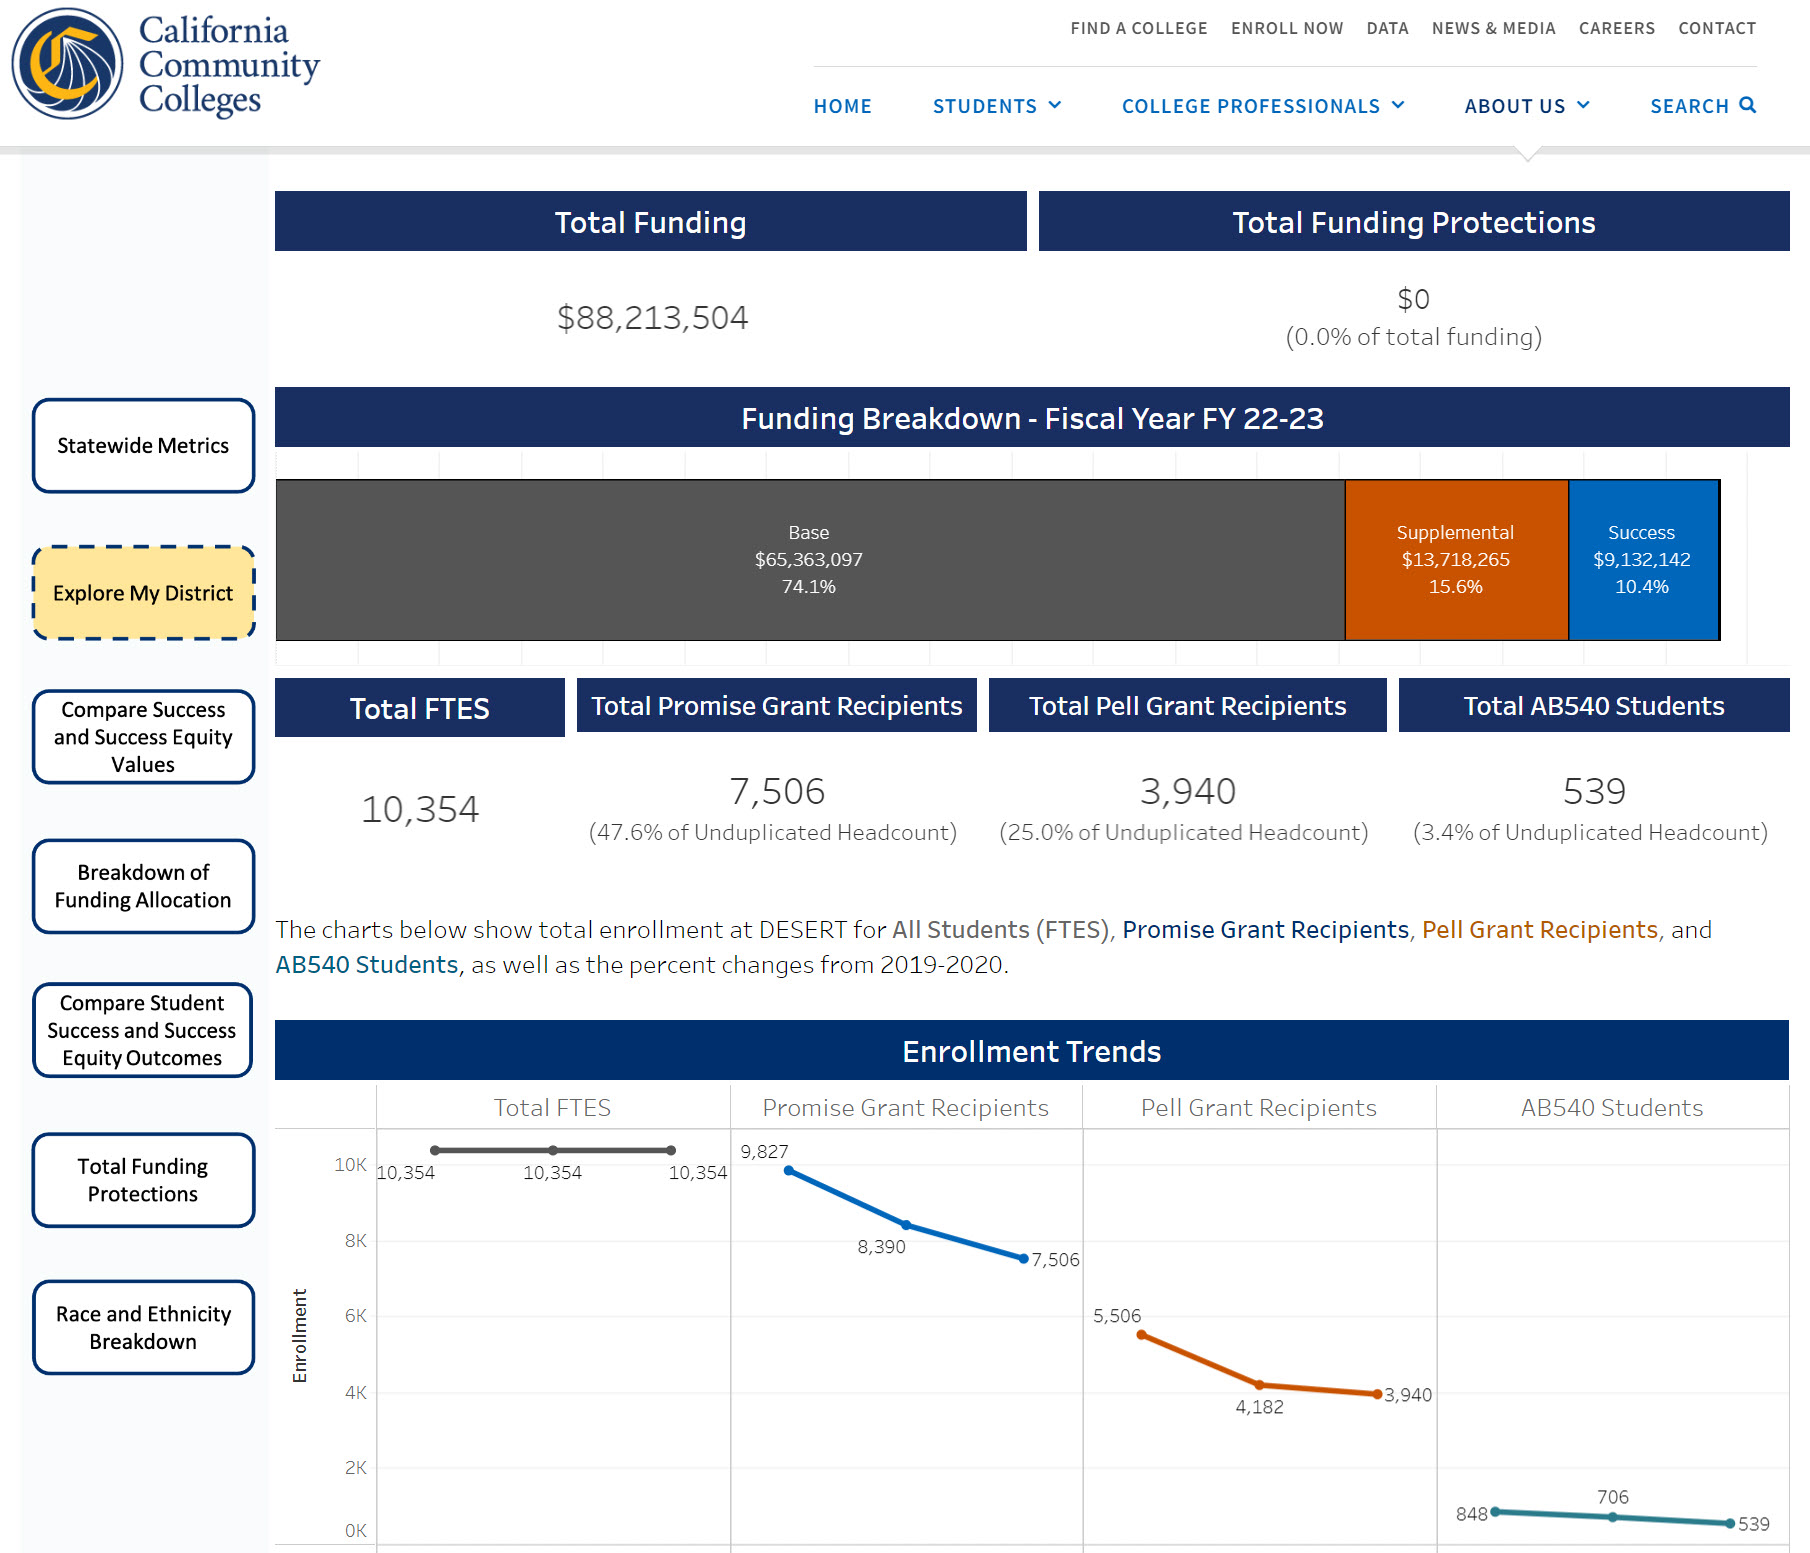
Student Centered Funding Formula - California Community Colleges Chancellor's Office
Student Centered Funding Formula Dashboard is available on California Community Colleges Chancellor's Website. Select "Explore
my district" highlighted option on the left side; scroll to the top to select DESERT
from the "Select a CCD" filter.

